. 2008 Nov;8(5):359-71.
doi: 10.1016/j.cmet.2008.09.008.

The glucagon receptor is required for the adaptive metabolic response to fasting

Affiliations

The glucagon receptor is required for the adaptive metabolic response to fasting

Christine Longuet et al. Cell Metab. 2008 Nov.

Abstract

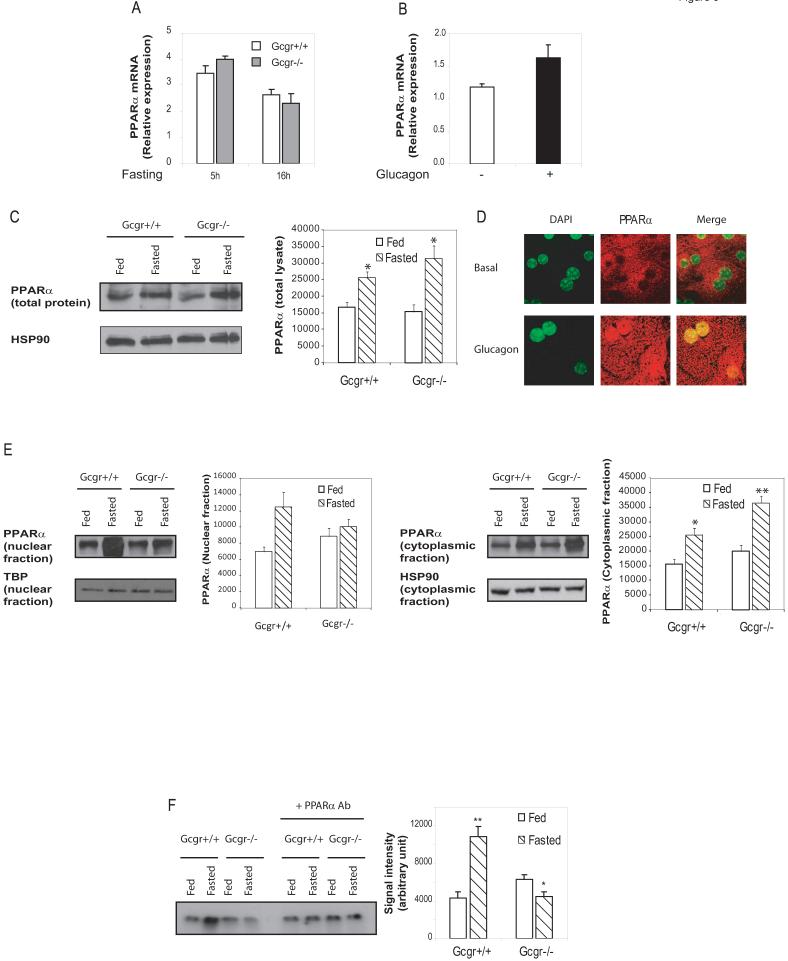
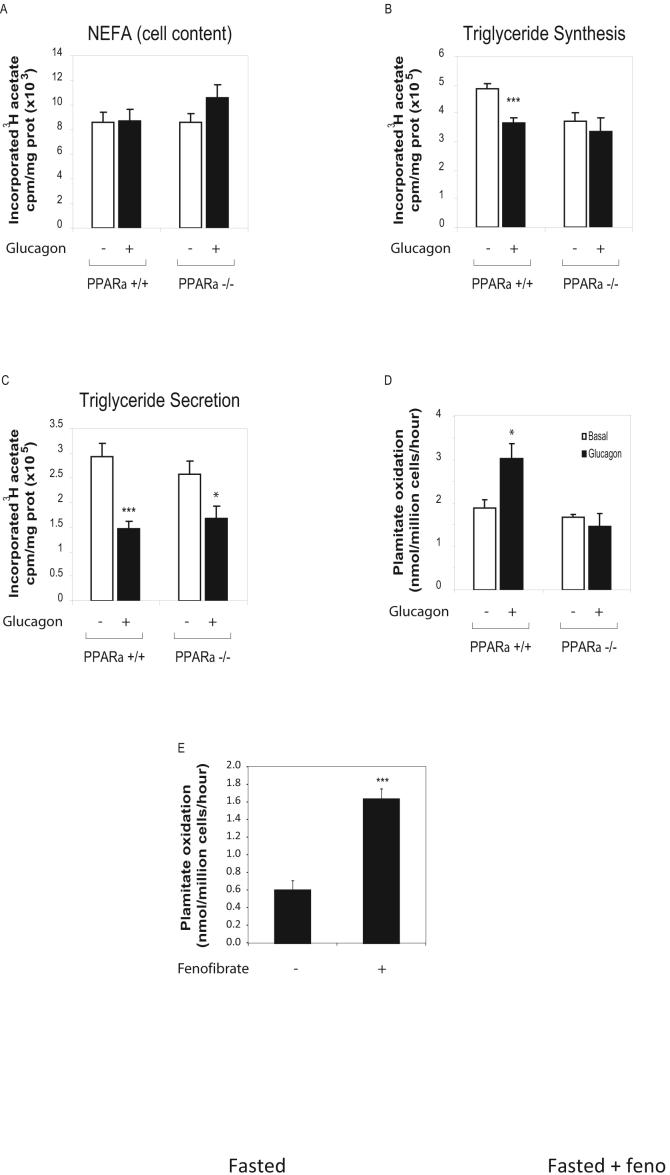
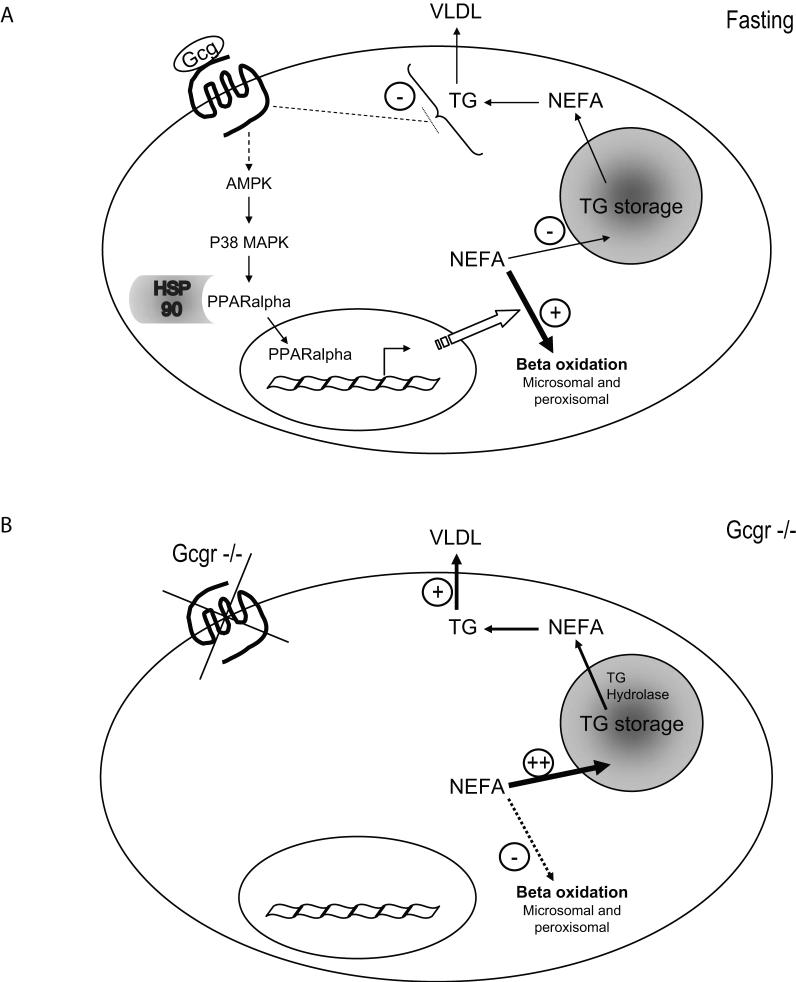
Glucagon receptor (Gcgr) signaling maintains hepatic glucose production during the fasting state; however, the importance of the Gcgr for lipid metabolism is unclear. We show here that fasted Gcgr-/- mice exhibit a significant increase in hepatic triglyceride secretion and fasting increases fatty acid oxidation (FAO) in wild-type (WT) but not in Gcgr-/- mice. Moreover fasting upregulated the expression of FAO-related hepatic mRNA transcripts in Gcgr+/+ but not in Gcgr-/- mice. Exogenous glucagon administration reduced plasma triglycerides in WT mice, inhibited TG synthesis and secretion, and stimulated FA beta oxidation in Gcgr+/+ hepatocytes. The actions of glucagon on TG synthesis and FAO were abolished in PPARalpha-/- hepatocytes. These findings demonstrate that the Gcgr receptor is required for control of lipid metabolism during the adaptive metabolic response to fasting.


Figures

Figure 1
Figure 1. Glucagon decreases levels of plasma TGs and inhibits hepatic TG secretion in vivo
TG (A and D) and FFA (B and E) levels were determined in plasma from Gcgr-/- male mice and Gcgr+/+ littermate controls fasted for 5 or 16 hours (A, B) or from WT males treated with glucagon for 24h (30 ng/g body weight) as described in methods (D, E). C and F) Hepatic TG secretion was assessed indirectly by measurement of plasma TGs after intravenous injection of triton WR-1339 in Gcgr-/- mice and +/+ littermate controls fasted for 16h (C) or WT males following a single glucagon injection, 30 ng/g BW as described in methods (F). Values are expressed as mean ± S.E.M. n = 4 to 11 mice per group. * = p<0.05; ** or # = p< 0.01; *** = p<0.001. ### = p< 0.001
Figure 2
Figure 2. Glucagon activates p38 MAPK in an AMPK-dependent manner
A and B) Primary mouse hepatocytes from WT mice were cultured with or without 20 nM glucagon following which total cell lysates were prepared and subjected to Western blot analysis as described in Methods. * = p<0.05, *** = p<0.001 for levels of phosphorylated proteins in the presence or absence of glucagon. C) Mouse hepatocytes were cultured for 30 minutes with or without 20 nM glucagon in the presence or absence of 2 μM H89, 10 μM SB203580 or 20 μM AMPKi. Data are mean ± S.E.M., n = 6. * = p<0.01 for values obtained in the presence or absence of glucagon
Figure 3
Figure 3. Glucagon modulates hepatic TG synthesis and secretion and FFA beta oxidation
Lipid synthesis was assessed by measurement of FFAs and TGs in WT hepatocytes (A, B, C, F, G, H) treated for 16 hours with or without 20 nM glucagon in the presence or absence of 10 μM SB203580, 2 μM H89 or 20 μM AMPKi (A, B, C) or 1 μM etomoxir (F, G, H). Lipids were extracted from the media (secretion) or cells + media (synthesis), separated by TLC and quantified by scintillation counting. Data are mean ± S.E.M. of 4 independent experiments. * = p<0.05, ** = p<0.01, *** = p<0.001 for values obtained in the presence or absence of glucagon. Beta oxidation of [1-14C]-palmitate assessed in liver homogenates prepared from Gcgr-/- or littermate controls fed or fasted for 24 hours (D); in primary hepatocytes from WT mice treated with or without 20 nM glucagon for 24h in the presence or absence of 10 μM SB203580 or 20 μM AMPKi (E) as described in methods. Data are mean ± S.E.M. of 6 independent experiments. * = p<0.05, ** = p<0.01 for fasted vs. the fed state in (D) and for vehicle vs. glucagon treated cells in (E); ## = p<0.01, ### = p<.001 for Gcgr+/+ vs. Gcgr-/- mice in D.
Figure 4
Figure 4. Hepatocyte gene expression profiles following fasting
Real time PCR was performed on RNA extracted from liver of male Gcgr-/- and littermate control +/+ mice after 5h or 16h fasting (A, B, D, E), and from WT males repeatedly injected with glucagon as described in methods (C, F). The relative level of mRNA transcripts detected was normalized to levels of GAPDH (A, B) or 18S (C). Data are mean ± S.E.M. (n = 4 to 11 mice in each group) and P values are assessed by one-way ANOVA test for comparison of gene expression * = p<0.05; ** = p< 0.01; *** = p<0.001 for differences in 5h vs. 16h fasted mice (A, B, D, E) or for vehicle vs. glucagon-treated mice (C, D). Facl2: Fatty Acid CoA ligase, long chain, 2; Decr2: 2-4-dienoyl-Coenzyme A reductase 2, peroxisomal; CPT1a: carnitine palmitoyltransferase 1A; CPT2: carnitine palmitoyltransferase 2; Acadm: acyl-Coenzyme A dehydrogenase, medium chain; Ehhadh: enoyl-Coenzyme A, hydratase/3-hydroxyacyl Coenzyme A dehydrogenase (Peroxisomal bifunctional enzyme); Hadha: hydroxyacyl-Coenzyme A dehydrogenase/3-ketoacyl-Coenzyme A thiolase/enoyl-Coenzyme A hydratase (mitochondrial trifunctional protein), alpha subunit; Hadhb: hydroxyacyl-Coenzyme A dehydrogenase/3-ketoacyl-Coenzyme A thiolase/enoyl-Coenzyme A hydratase (mitochondrial trifunctional protein), beta subunit. Acly: ATP citrate lyase; Fas: fatty acid synthase; Mod: malic enzyme; Lce: long chain fatty acid elongase; Acacb: acetyl-Coenzyme A carboxylase beta; SCD1: stearoyl-Coenzyme A desaturase 1
Figure 5
Figure 5. Glucagon activates PPARα in a p38 MAPK-and AMPK-dependent manner
Quantification of hepatic PPARα mRNA transcripts from male Gcgr-/- vs. Gcgr+/+ littermate controls fasted for 5 or 16 hours (A) or from WT male mice following chronic glucagon administration (B). Data are mean ± S.E.M. (n = 4 to 11 mice in each group). C) Total liver lysates from Gcgr+/+ and Gcgr-/- either fed or fasted for 16h were subjected to western blot analysis as described in methods. * = p<0.05 for levels of proteins in the fed vs fasted state. Data are mean ± S.E.M. (n = 4 mice in each group) D) Immunofluorescence staining of PPARα protein in primary mouse hepatocytes cultured in vitro with or without 20 nM glucagon for 30 minutes. E) Nuclear (left panel) and cytoplasmic (right panel) fractions were purified from liver of Gcgr+/+ and Gcgr-/- either fed or fasted for 16h and nuclear proteins were analyzed by Western blotting as described in methods. HSP90 (cytoplasmic fraction) and TATA Binding Protein (TBP) (nuclear fraction) where used as loading controls. No HSP90 was detectable in the nuclear fraction, and no TBP was detectable in cytoplasmic fraction (data not shown)* = p<0.05 for levels of proteins in the fed vs fasted state. Data are mean ± S.E.M. (n = 4 mice in each group) F) Gel shift motility assay was performed using nuclear extract from liver of Gcgr-/- mice or littermate controls either fed or fasted for 16h, incubated with a radiolabelled ACO-probe as described in methods. Data are mean ± S.E.M. of 4 independent experiments. * = p<0.05 ** = p<0.01 for fed vs. fasted mice. G I and J) Primary hepatocytes prepared from PPARα+/+ or PPARα-/- mice (I) or from WT mice (G and J) were transfected with the PPAR-responsive luciferase reporter pHD(X3)Luc, and further incubated for 24 hours with vehicle alone or 20 nM glucagon, with or without 10 μM SB203580 (J) or with or without 500 nM 17DMAG (G) Data are mean ± S.E.M. of 3 experiments. ** = p<0.01 for control vs. glucagon-treated cells; ## = p<0.01 for glucagon-stimulated PPARα+/+ vs PPAR-/- hepatocytes or glucagon treatment in control vs. SB203580-treated hepatocytes. H) After 30 min stimulation with 20 nM glucagon with or without 500 nM 17 DMAG, nuclear and cytoplasmic fractions were purified from primary WT hepatocytes. PPARα was immunoprecipitated in each fraction and blotted for HSP90 (upper panel) or phosphoserine (lower panels) HSP90 (cytoplasmic fraction) and TATA Binding Protein (TBP) (nuclear fraction) were used as loading controls. K and L) PPARα was immunoprecipitated from liver lysate prepared from Gcgr+/+ and Gcgr-/- fed or fasted for 16h (K), or from WT mice injected with glucagon (L), then subjected to western blot analysis using an anti-p38 MAPK antibody. Total p38MAPK in total lysate is shown as a loading control.
Figure 6
Figure 6. Glucagon increases FAO and inhibits TG synthesis in a PPARα-dependent manner
A, B and C) Lipid synthesis was assessed by measurement of FFAs and TGs in hepatocytes from WT and PPARα-/- mice treated for 16 hours with or without 20 nM glucagon. Lipids were extracted from the media (secretion) or cells + media (synthesis), separated by TLC and quantified by scintillation counting. Data are mean ± S.E.M. of 4 independent experiments. * = p<0.05, *** = p<.001 for values obtained in the presence or absence of glucagon. D) Beta oxidation of [14C]- palmitate assessed in primary hepatocytes from WT or PPARα-/- mice and treated with or without 20 nM glucagon for 24h as described in methods. E) Beta oxidation of [1-14C]-palmitate assessed in liver homogenates prepared from Gcgr-/- fasted for 24 hours with or without fenofibrate administration during fasting as described in methods. Data are mean ± S.E.M. of 6 independent experiments. * = p<0.05 for vehicle vs. glucagon treated cells in (C)
Figure 7
Figure 7. The effects of glucagon on hepatic lipid metabolism
A) During fasting, glucagon sequentially activates AMPK and p38 MAPK, leading to the dissociation from HSP90 and nuclear translocation and transcriptional activation of PPARα, which then stimulates the transcription of genes involved in FFA beta oxidation. Glucagon increases the ratio of FFAs targeted to beta oxidation vs TG synthesis, resulting in decreased TG storage. Glucagon also decreases TG secretion, independently of PPARα activation and FFA beta oxidation. B) In the absence of glucagon signalling in Gcgr-/- mice, FFA beta oxidation is decreased, leading to increased TG storage/secretion.

References

    1. Aromataris EC, Roberts ML, Barritt GJ, Rychkov GY. Glucagon activates Ca2+ and Cl- channels in rat hepatocytes. J Physiol. 2006;573:611–625. - PMC - PubMed
    1. Bobe G, Ametaj BN, Young JW, Anderson LL, Beitz DC. Exogenous glucagon effects on health and reproductive performance of lactating dairy cows with mild fatty liver. Anim Reprod Sci. 2006 - PubMed
    1. Bobe G, Ametaj BN, Young JW, Beitz DC. Effects of exogenous glucagon on lipids in lipoproteins and liver of lactating dairy cows. J Dairy Sci. 2003a;86:2895–2903. - PubMed
    1. Bobe G, Ametaj BN, Young JW, Beitz DC. Potential treatment of fatty liver with 14-day subcutaneous injections of glucagon. J Dairy Sci. 2003b;86:3138–3147. - PubMed
    1. Cao W, Collins QF, Becker TC, Robidoux J, Lupo EG, Jr., Xiong Y, Daniel KW, Floering L, Collins S. p38 Mitogen-activated protein kinase plays a stimulatory role in hepatic gluconeogenesis. J Biol Chem. 2005;280:42731–42737. - PubMed

Publication types

MeSH terms