

Coalescence times and FST under a skewed offspring distribution among individuals in a population
- PMID: 19047415
- PMCID: PMC2644951
- DOI: 10.1534/genetics.108.094342
Coalescence times and FST under a skewed offspring distribution among individuals in a population
Abstract
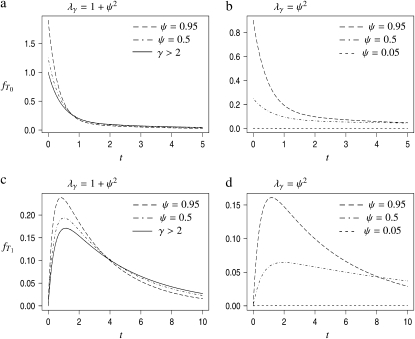
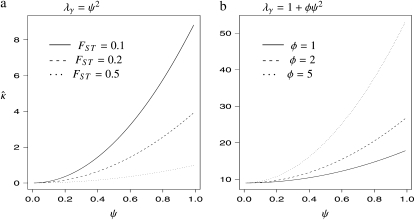
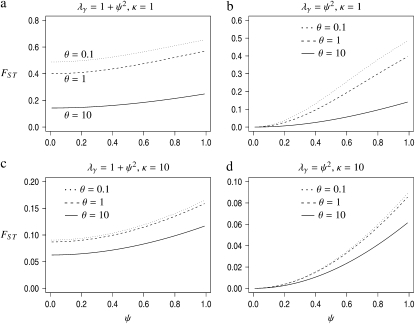
Estimates of gene flow between subpopulations based on F(ST) (or N(ST)) are shown to be confounded by the reproduction parameters of a model of skewed offspring distribution. Genetic evidence of population subdivision can be observed even when gene flow is very high, if the offspring distribution is skewed. A skewed offspring distribution arises when individuals can have very many offspring with some probability. This leads to high probability of identity by descent within subpopulations and results in genetic heterogeneity between subpopulations even when Nm is very large. Thus, we consider a limiting model in which the rates of coalescence and migration can be much higher than for a Wright-Fisher population. We derive the densities of pairwise coalescence times and expressions for F(ST) and other statistics under both the finite island model and a many-demes limit model. The results can explain the observed genetic heterogeneity among subpopulations of certain marine organisms despite substantial gene flow.
Figures
References
-
- Árnason, E., P. H. Petersen, K. Kristinsson, H. Sigurgíslason and S. Pálsson, 2000. Mitochondrial cytochrome b DNA sequence variation of Atlantic cod from Iceland and Greenland. J. Fish Biol. 56 409–430.
-
- Avise, J. C., 1994. Molecular Markers, Natural History and Evolution. Chapman & Hall, New York.
-
- Avise, J. C., R. M. Ball and J. Arnold, 1988. Current versus historical population sizes in vertebrate species with high gene flow: a comparison based on mitochondrial DNA lineages and inbreeding theory for neutral mutations. Mol. Biol. Evol. 5 331–344. - PubMed
-
- Beckenbach, A. T., 1994. Mitochondrial haplotype frequencies in oysters: neutral alternatives to selection models, pp. 188–198 in Non-Neutral Evolution, edited by B. Golding. Chapman & Hall, New York.
MeSH terms
Substances
LinkOut - more resources
Full Text Sources
Miscellaneous
