

Nucleotide variation, linkage disequilibrium and founder-facilitated speciation in wild populations of the zebra finch (Taeniopygia guttata)
- PMID: 19047416
- PMCID: PMC2644953
- DOI: 10.1534/genetics.108.094250
Nucleotide variation, linkage disequilibrium and founder-facilitated speciation in wild populations of the zebra finch (Taeniopygia guttata)
Abstract
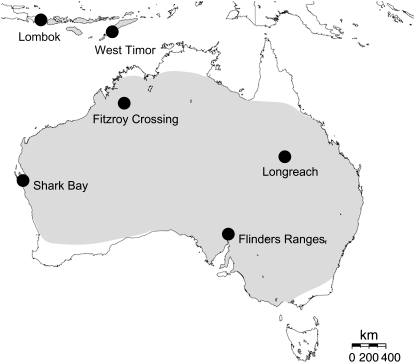
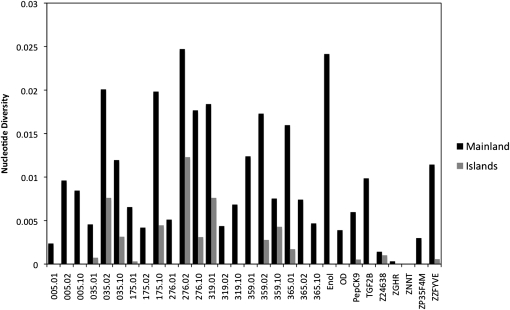
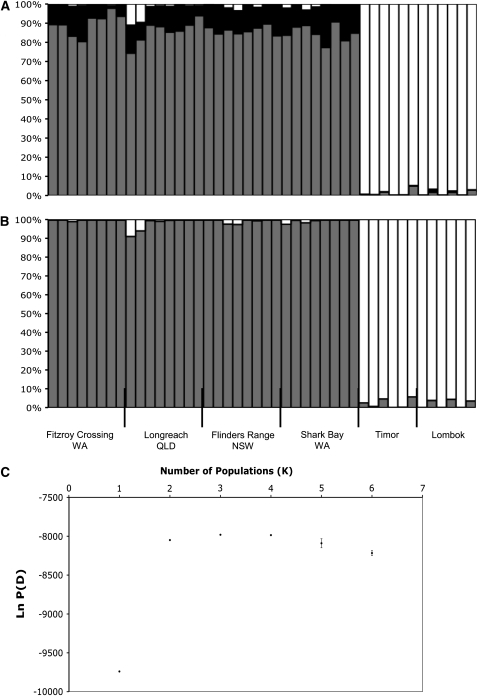
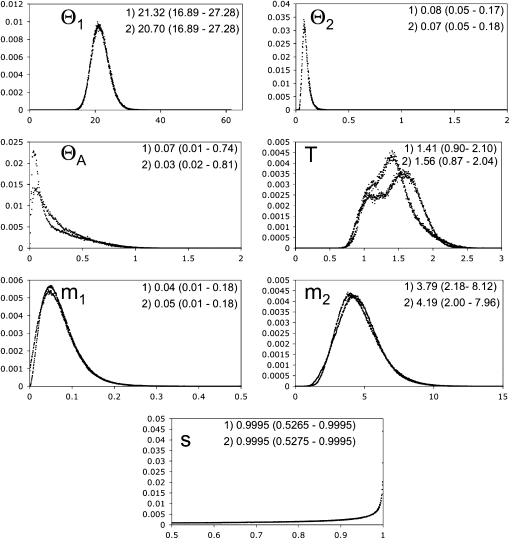
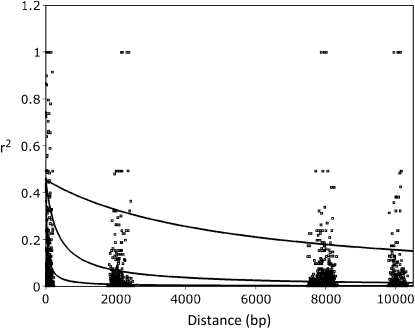
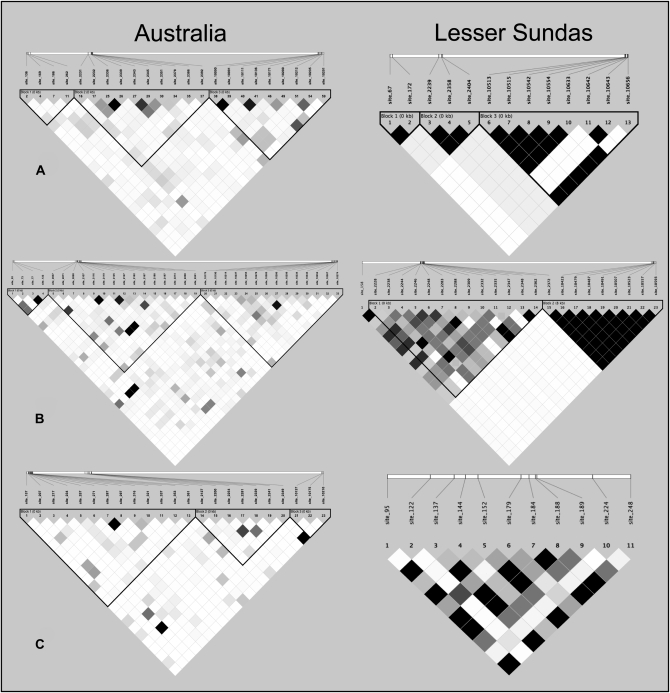
The zebra finch has long been an important model system for the study of vocal learning, vocal production, and behavior. With the imminent sequencing of its genome, the zebra finch is now poised to become a model system for population genetics. Using a panel of 30 noncoding loci, we characterized patterns of polymorphism and divergence among wild zebra finch populations. Continental Australian populations displayed little population structure, exceptionally high levels of nucleotide diversity (pi = 0.010), a rapid decay of linkage disequilibrium (LD), and a high population recombination rate (rho approximately 0.05), all of which suggest an open and fluid genomic background that could facilitate adaptive variation. By contrast, substantial divergence between the Australian and Lesser Sunda Island populations (K(ST) = 0.193), reduced genetic diversity (pi = 0.002), and higher levels of LD in the island population suggest a strong but relatively recent founder event, which may have contributed to speciation between these populations as envisioned under founder-effect speciation models. Consistent with this hypothesis, we find that under a simple quantitative genetic model both drift and selection could have contributed to the observed divergence in six quantitative traits. In both Australian and Lesser Sundas populations, diversity in Z-linked loci was significantly lower than in autosomal loci. Our analysis provides a quantitative framework for studying the role of selection and drift in shaping patterns of molecular evolution in the zebra finch genome.
Figures
References
-
- Anderson, C. N. K., U. Ramakrishnan, Y. L. Chan and E. A. Hadly, 2005. Serial SimCoal: a population genetics model for data from multiple populations and points in time. Bioinformatics 21 1733–1734. - PubMed
-
- Anderson, E. C., and M. Slatkin, 2007. Estimation of the number of individuals founding colonized populations. Evolution 61 972–983. - PubMed
-
- Andolfatto, P., 2001. Contrasting patterns of X-linked and autosomal nucleotide variation in Drosophila melanogaster and Drosophila simulans. Mol. Biol. Evol. 18 279–290. - PubMed
-
- Axelsson, E., L. Hultin-Rosenberg, M. Brandstrom, M. Zwahlen, D. F. Clayton et al., 2008. Natural selection in avian protein-coding genes expressed in brain. Mol. Ecol. 17 3008–3017. - PubMed
-
- Bachtrog, D., and B. Charlesworth, 2002. Reduced adaptation of a non-recombining neo-Y chromosome. Nature 416 323–326. - PubMed
Publication types
MeSH terms
Substances
LinkOut - more resources
Full Text Sources
Research Materials
Miscellaneous
