. 2008 Winter;7(4):422-30.
doi: 10.1187/cbe.08-08-0045.

The Genetics Concept Assessment: a new concept inventory for gauging student understanding of genetics

Affiliations

The Genetics Concept Assessment: a new concept inventory for gauging student understanding of genetics

Michelle K Smith et al. CBE Life Sci Educ. 2008 Winter.

Abstract

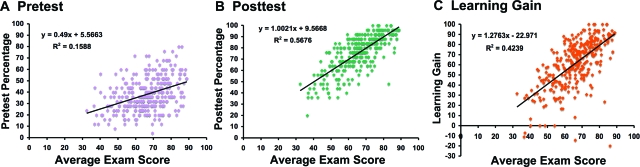
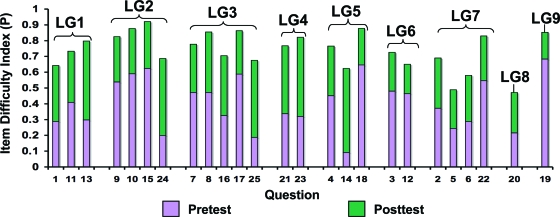
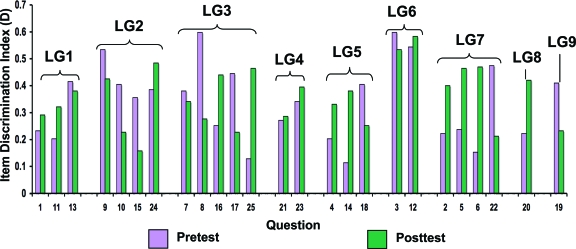
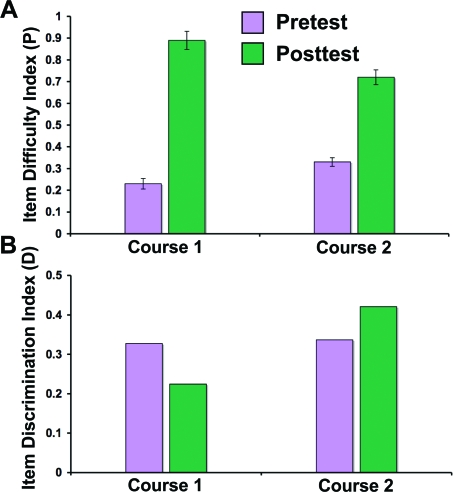
We have designed, developed, and validated a 25-question Genetics Concept Assessment (GCA) to test achievement of nine broad learning goals in majors and nonmajors undergraduate genetics courses. Written in everyday language with minimal jargon, the GCA is intended for use as a pre- and posttest to measure student learning gains. The assessment was reviewed by genetics experts, validated by student interviews, and taken by >600 students at three institutions. Normalized learning gains on the GCA were positively correlated with averaged exam scores, suggesting that the GCA measures understanding of topics relevant to instructors. Statistical analysis of our results shows that differences in the item difficulty and item discrimination index values between different questions on pre- and posttests can be used to distinguish between concepts that are well or poorly learned during a course.


Figures

Figure 1.
Figure 1.
Correlation of pretest score versus average exam score (A), posttest score versus average exam score (B), and learning gain versus average exam score (C). The equation of the trend line and R2 value are displayed on each graph.
Figure 2.
Figure 2.
P values for each question on the GCA pretest and posttest. P values represent percentages of correct answers; therefore, lower values indicate more difficult questions. Results are based on combined responses from 607 students in five different genetics courses. Different colored bars show the increase in correct answer percentages between pretest and posttest for each question, indicating the extent of student learning on the corresponding concepts. Questions are grouped according to learning goal (see Table 2).
Figure 3.
Figure 3.
D values for questions on the GCA pretest and posttest. Results were calculated (see Methods) from the same data set as in Figure 2. Questions that have higher D values more effectively discriminate between students whose overall test scores identify them as strong or weak students (Doran, 1980). Questions that show high D values on the pretest (only strong students answered them correctly) and low D values on the posttest (most students answered correctly) correspond to concepts on which most students gained understanding during the course. Questions with high D values on both the pre- and posttests correspond to concepts that primarily only the stronger students understood at the end of the course. Questions are grouped according to learning goal (see Table 2).
Figure 4.
Figure 4.
Item difficulty (A) and item discrimination (B) index values for question 13 in two majors genetics courses taught by different instructors. Students in courses 1 and 2 showed similar P and D index values on the pretest, but on the posttest, students in course 1 had a significantly (p < 0.05) higher P value and a lower D value compared with students in course 2. These results suggest that the instruction in course 1 was more effective in promoting student learning gains for the concept addressed in this question (see legends to Figures 2 and 3).

References

    1. Adams W. K., Perkins K. K., Podolefsky N. S., Dubson M., Finkelstein N. D., Wieman C. E. New instrument for measuring student beliefs about physics and learning physics: the Colorado learning attitudes about science survey. Phys. Rev.-PER. 2006;2:010101.
    1. Anderson D. L., Fisher K. M., Norman G. J. Development and evaluation of the conceptual inventory of natural selection. J. Res. Sci. Teach. 2002;39:952–978.
    1. Bowling B. V., Acra E. E., Wang L., Myers M. F., Dean G. E., Markle G. C., Moskalik C. L., Huether C. A. Development and evaluation of a genetics literacy assessment instrument for undergraduates. Genetics. 2008;178:15–22. - PMC - PubMed
    1. Chabay R., Sherwood B. Qualitative understanding and retention. AAPT Announcer. 1997;27:S12.
    1. Chattopadhyay A. Understanding of genetic information in higher secondary students in northeast India and the implications for genetics education. Cell Biol. Educ. 2005;4:97–104. - PMC - PubMed

Publication types

LinkOut - more resources