. 2008 Dec 22;205(13):2995-3006.
doi: 10.1084/jem.20080462. Epub 2008 Dec 1.

TLR7-dependent and FcgammaR-independent production of type I interferon in experimental mouse lupus

Affiliations

TLR7-dependent and FcgammaR-independent production of type I interferon in experimental mouse lupus

Pui Y Lee et al. J Exp Med. .

Abstract

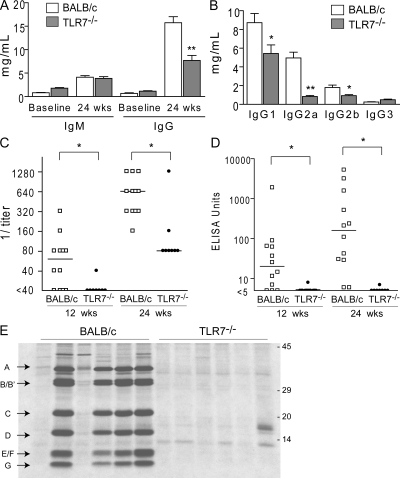
Increased type I interferon (IFN-I) production and IFN-stimulated gene (ISG) expression are linked to the pathogenesis of systemic lupus erythematosus (SLE). Although the mechanisms responsible for dysregulated IFN-I production in SLE remain unclear, autoantibody-mediated uptake of endogenous nucleic acids is thought to play a role. 2,6,10,14-tetramethylpentadecane (TMPD; also known as pristane) induces a lupus-like disease in mice characterized by immune complex nephritis with autoantibodies to DNA and ribonucleoproteins. We recently reported that TMPD also causes increased ISG expression and that the development of the lupus is completely dependent on IFN-I signaling (Nacionales, D.C., K.M. Kelly-Scumpia, P.Y. Lee, J.S. Weinstein, R. Lyons, E. Sobel, M. Satoh, and W.H. Reeves. 2007. Arthritis Rheum. 56:3770-3783). We show that TMPD elicits IFN-I production, monocyte recruitment, and autoantibody production exclusively through a Toll-like receptor (TLR) 7- and myeloid differentiation factor 88 (MyD88)-dependent pathway. In vitro studies revealed that TMPD augments the effect of TLR7 ligands but does not directly activate TLR7 itself. The effects of TMPD were amplified by the Y-linked autoimmune acceleration cluster, which carries a duplication of the TLR7 gene. In contrast, deficiency of Fcgamma receptors (FcgammaRs) did not affect the production of IFN-I. Collectively, the data demonstrate that TMPD-stimulated IFN-I production requires TLR7/MyD88 signaling and is independent of autoantibody-mediated uptake of ribonucleoproteins by FcgammaRs.


Figures

Figure 1.
Figure 1.
TMPD-induced IFN-I production requires MyD88. (A) Comparison of the number of total PECs, Ly6Chi monocytes, and granulocytes 2 wk after TMPD treatment in wild-type (n = 5), MyD88−/− (n = 6), TRIF−/− (n = 4), and IFNAR−/− mice (n = 4). (B) Flow cytometry of peritoneal cells (box indicates Ly6Chi monocytes and dashed oval indicates granulocytes). (C) RT-PCR analysis of Mx1 and IRF7 expression in PECs (normalized to peritoneal cells from an untreated wild-type mouse). (D) ELISA quantification of MCP-1 in the peritoneal lavage fluid of TMPD-treated mice. (E) Flow cytometry analysis of Sca-1 expression on peripheral blood mononuclear cells. Mean fluorescence intensity (MFI) of Sca-1 on B220+ cells is shown. Each bar represents the mean, and error bars indicate SE. Data are representative of two or more independent experiments. *, P < 0.05 using the Student's t test.
Figure 2.
Figure 2.
Cytoplasmic nucleic acid sensors do not contribute to IFN-I production. RT-PCR analysis of Mx1 and IRF7 expression in PECs from wild-type (n = 5), IPS-1−/− (n = 5), TNF−/− (n = 2), and TNF−/−TBK-1−/− (n = 4) animals (normalized to peritoneal cells from an untreated wild-type animal). Each bar represents the mean, and error bars indicate SE. Data are representative of two independent experiments.
Figure 3.
Figure 3.
IFN-I production induced by TMPD is TLR7 dependent. (A) Comparison of the number of total PECs, Ly6Chi monocytes, and granulocytes 2 wk after TMPD treatment in wild-type (n = 5), TLR7−/− (n = 5), and TLR9−/− (n = 5) mice. (B) Flow cytometry analysis of peritoneal cells (box indicates Ly6Chi monocytes and dashed oval indicates granulocytes). (C) RT-PCR analysis of Mx1 and IRF7 expression in PECs (normalized to peritoneal cells from an untreated wild-type animal) and ELISA quantification of MCP-1 in the peritoneal lavage fluid. (D) Flow cytometry of Sca-1 surface expression on peripheral blood mononuclear cells. MFI of Sca-1 on B220+ cells is shown. Each bar in A and C represents the mean (n > 4 per group), and error bars indicate SE. Data are representative of two independent experiments. *, P < 0.05 using the Student's t test.
Figure 4.
Figure 4.
FcγRI and FcγRIII are dispensable for IFN-I induction by TMPD. (A) Flow cytometry analysis of FcγRI (CD64) and FcγRII/III (CD32/CD16) in PEC populations in TMPD-treated wild-type mice (open histograms). Shaded histograms represent staining with isotype control antibodies. (B) Peritoneal cell influx and (C) ISG expression in wild-type mice and FcγRI/III−/− (γ chain–deficient) mice (n = 3 per group) 2 wk after TPMD treatment. Dashed boxes in B indicate Ly6Chi monocytes. Each bar in C represents the mean, and error bars indicate SE. Data are representative of two independent experiments.
Figure 5.
Figure 5.
Ly6Chi monocytes express high levels of TLR7. (A) RT-PCR analysis of TLR expression in sorted PEC populations, splenic Ly6Chi monocytes, and bone marrow monocyte precursors from wild-type TMPD-treated mice. (B) RT-PCR analysis of TLR7 and TLR9 expression in PECs from TMPD-treated mice 48 h after i.p. injection of PBS or clo-lip. Each bar represents the mean, and error bars indicate SE. (C) ELISA for MCP-1 and IL-6 produced by sorted peritoneal Ly6Chi monocytes (5 × 10⁴ cells/well) 24 h after TLR ligand stimulation. Wedges denote increasing concentrations of LPS, R848, and CpG DNA (100 ng/ml, 1 μg/ml, and 10 μg/ml), and poly I:C (200 ng/ml, 2 μg/ml, and 20 μg/ml). Data are representative of two independent experiments.
Figure 6.
Figure 6.
Yaa mutation amplifies the effects of TMPD. (A) Flow cytometry of peritoneal cells and (B) RT-PCR analysis of ISG expression in BXSB × B6 female (TLR7+/+) and male (TLR7+/Yaa) mice. Dashed boxes in A indicate Ly6Chi monocytes. Each bar in B represents the mean, and error bars indicate SE. Data are representative of two independent experiments. *, P < 0.05 using the Student's t test. (C) Survival curve for male BXSB mice after PBS or TMPD treatment (arrow denotes treatment at 8–10 wk of age).
Figure 7.
Figure 7.
TLR7 promotes hypergammaglobulinemia and mediates the development of anti-nRNP/Sm autoantibodies. (A) Total IgM and IgG and (B) IgG subclass levels in BALB/c.TLR7−/− (n = 8) and wild-type BALB/c (n = 12) mice before and 24 wk after TMPD treatment. Bars represent the mean, and error bars indicate SE. *, P < 0.05; and **, P < 0.001 using the unpaired t test. (C) Fluorescent ANA titers (titration emulation) and (D) anti-nRNP/Sm IgG levels (antigen-capture ELISA) at 12 and 24 wk after TMPD treatment. Horizontal lines indicate medians. *, P < 0.05 using the Mann-Whitney U test. (E) Immunoprecipitation of serum autoantibodies (n = 6 per group) using nuclear extracts from 35S-labeled K562 cells (12.5% polyacrylamide gel). Arrows indicate components of nRNP/Sm, and numerical values denote the molecular mass (kD).
Figure 8.
Figure 8.
TLR7 is required for the development of anti-Su/ago2 autoantibodies. (A) Immunoprecipitation of serum autoantibodies 24 wk after TMPD treatment (8% polyacrylamide gel; n = 6 per group). Arrows indicate the 100-kD Su antigen, and numerical values denote the molecular mass (kD). (B) Anti-Su/ago levels at baseline and 24 wk after TMPD treatment measured by ELISA using recombinant ago2 protein. Horizontal lines indicate medians. *, P < 0.05 using the Mann-Whitney U test.
Figure 9.
Figure 9.
TMPD enhances TLR7 stimulation in vitro. (A) ELISA for IL-6 production in J774 cells cultured in the presence of 1 μg/ml R848, 1 μg/ml TMPD incorporated in serum, or 300 μM TMPD solubilized in ethanol, DMSO, mannide monooleate (MM), or β-cyclodextrin (β-CyD). ND, not detectable. (B) ELISA (IL-6 and MCP-1) and flow cytometric analysis (CD80 and CD86) in J774 cells or (C) bone marrow-derived macrophages cultured for 20 h with or without TMPD and stimulated with PBS, 1 μg/ml R848, or 2 μg/ml ODN 2395 for 24 h. MFI values are provided. Shaded histograms represent J774 cells cultured in medium alone, whereas open histograms represent cells treated with TMPD. (D) Comparison of IL-6 production and CD80 expression (MFI) in J774 cells cultured with various hydrocarbon oils and stimulated with PBS or R848. (E) Flow cytometry and RT-PCR analysis of TLR7 expression in J774 cells cultured with or without TMPD for 20 h. Each bar represents the mean, and error bars indicate SE. Data are representative of three or more independent experiments.

References

    1. Reeves, W.H., S. Narain, and M. Satoh. 2005. Autoantibodies in systemic lupus erythematosus. In Arthritis and Allied Conditions: A Textbook of Rheumatology. 15th edition. W.J. Koopman and L.W. Moreland, editors. Lippincott Williams & Wilkins, Philadelphia. 1497–1521.
    1. Kirou, K.A., C. Lee, S. George, K. Louca, M.G. Peterson, and M.K. Crow. 2005. Activation of the interferon-alpha pathway identifies a subgroup of systemic lupus erythematosus patients with distinct serologic features and active disease. Arthritis Rheum. 52:1491–1503. - PubMed
    1. Bennett, L., A.K. Palucka, E. Arce, V. Cantrell, J. Borvak, J. Banchereau, and V. Pascual. 2003. Interferon and granulopoiesis signatures in systemic lupus erythematosus blood. J. Exp. Med. 197:711–723. - PMC - PubMed
    1. Baechler, E.C., F.M. Batliwalla, G. Karypis, P.M. Gaffney, W.A. Ortmann, K.J. Espe, K.B. Shark, W.J. Grande, K.M. Hughes, V. Kapur, et al. 2003. Interferon-inducible gene expression signature in peripheral blood cells of patients with severe lupus. Proc. Natl. Acad. Sci. USA. 100:2610–2615. - PMC - PubMed
    1. Zhuang, H., S. Narain, E. Sobel, P.Y. Lee, D.C. Nacionales, K.M. Kelly, H.B. Richards, M. Segal, C. Stewart, M. Satoh, and W.H. Reeves. 2005. Association of anti-nucleoprotein autoantibodies with upregulation of Type I interferon-inducible gene transcripts and dendritic cell maturation in systemic lupus erythematosus. Clin. Immunol. 117:238–250. - PubMed

Publication types

MeSH terms