. 2008 Dec 9;105(49):19486-91.
doi: 10.1073/pnas.0808113105. Epub 2008 Dec 1.

Functional network reorganization during learning in a brain-computer interface paradigm

Affiliations

Functional network reorganization during learning in a brain-computer interface paradigm

Beata Jarosiewicz et al. Proc Natl Acad Sci U S A. .

Abstract

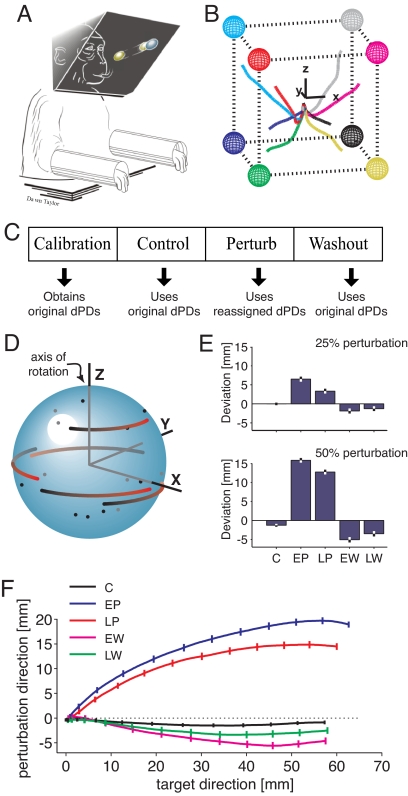
Efforts to study the neural correlates of learning are hampered by the size of the network in which learning occurs. To understand the importance of learning-related changes in a network of neurons, it is necessary to understand how the network acts as a whole to generate behavior. Here we introduce a paradigm in which the output of a cortical network can be perturbed directly and the neural basis of the compensatory changes studied in detail. Using a brain-computer interface, dozens of simultaneously recorded neurons in the motor cortex of awake, behaving monkeys are used to control the movement of a cursor in a three-dimensional virtual-reality environment. This device creates a precise, well-defined mapping between the firing of the recorded neurons and an expressed behavior (cursor movement). In a series of experiments, we force the animal to relearn the association between neural firing and cursor movement in a subset of neurons and assess how the network changes to compensate. We find that changes in neural activity reflect not only an alteration of behavioral strategy but also the relative contributions of individual neurons to the population error signal.


Conflict of interest statement

The authors declare no conflict of interest.

Figures

Fig. 1.
Fig. 1.
Experimental design. (A) Schematic of the center-out brain-control paradigm. Monkeys were required to move a spherical cursor from the center of an imaginary cube in 3D virtual reality (VR) to a spherical target appearing at one of its eight corners. (B) Average trajectories to each target during one control session. Axes are inset for reference. (C) Timeline of recording session in one data set (left to right). (D) Schematic dPD rotation for a z-axis perturbation. The original dPDs (black dots) of a subset of units were rotated 90° to create the reassigned dPDs (red ends of comets). (E) Mean (± SE) of the cursor deviation in the direction of the perturbation, evaluated when the cursor moved half the distance to the target. Separate bars are shown for control (C), early perturbation (EP), late perturbation (LP), early washout (EW), and late washout (LW). The top panel shows the results from experiments in which 25% of the units were rotated; the bottom panel shows the results from experiments in which 50% were rotated. (F) Average trajectories from all experiments in which 50% of the units were rotated. To average trajectories from different targets, each trajectory was rotated into a common space, where the x-axis represents movement toward the target and the y-axis represents movement orthogonal to the target in the direction of the applied perturbation (20). Trajectories are collapsed along the z-axis, which represents movement orthogonal to both the target and the perturbation (noise). For information on movement times, see Table S1.
Fig. 2.
Fig. 2.
Schematic of the influence of the perturbation on the population vector and of three possible compensation mechanisms. (A) Population vector before perturbation. When moving toward the target shown in blue, units with preferred directions pointing toward the target will fire above their baseline rates. The gray lines represent vectors pointing toward the dPD of each unit, with the length of the vector scaled by the neuron's normalized firing rate. The sum of these vectors is the population vector, shown in black. On average, this population vector will point straight toward the target. (B) After the perturbation, the same units shown in (A) will be recruited, but some will contribute differently to the population vector because of their rotated dPDs. Rotated units are shown in pink. The result is a population vector that does not point at the target. (C) Re-aiming. By aiming at the virtual target (dotted blue circle), a different set of neurons is recruited with PDs that point toward the virtual target. The net contribution of the rotated and nonrotated units will cause the population vector to move straight toward the actual target. Note that the length of the population vector is shorter than in (A) because the units that contribute to it have more dispersed dPDs. (D) Re-weighting. By selectively reducing the contribution of the rotated units (down-modulating their firing rates), the population vector straightens toward the target. (E) Re-mapping. By recruiting only unperturbed cells that point toward the target and perturbed cells that point 90° from the target, the population vector can be made to point directly at the target with its original length.
Fig. 3.
Fig. 3.
PDs shift during the perturbation session. (A and B) Shift in the PD measured during the perturbation session relative to the control session for all units in experiments where 25% (A) or 50% (B) of the units were rotated. Small dots represent the individual data points and large dots represent the means of the rotated (red) and nonrotated (blue) groups. The intensity of each point is proportional to the certainty of the estimate for that point (see SI Appendix). (C and D) Empirical cumulative distribution functions (CDFs) of the PD shift along the direction of applied perturbation. In each case, the CDF of the rotated group is shifted significantly to the right of the CDF of the nonrotated group. (E and F) Same as (A) and (B) for the washout session. The nonrotated group's mean is obscured by the rotated group's mean.
Fig. 4.
Fig. 4.
Trajectory error contributions from the rotated and nonrotated populations of units as a function of time. The y-axis in each plot is the perturbation-induced error: that is, the deviation of the cursor from the ideal straight-line trajectory, in the direction of the applied perturbation. (A) Perturbation-induced error during the early part of the perturbation session. The black line denotes the actual cursor trajectory, the red line denotes the component of that trajectory arising from the rotated units, and the blue line denotes the component arising from the nonrotated units. Colored arrows indicate the time that the corresponding population first deviates significantly from baseline (according to a two-sided t test). (B) Same as (A), for trajectories recorded during the late part of the perturbation session. The early trajectories are shown as dotted lines for reference. (C) The difference in deviation from the early perturbation trials to the late perturbation trials for each population.
Fig. 5.
Fig. 5.
Comparison of trajectories between the early (dashed) and late (solid) perturbation sessions. To look at learning-related changes, we compared the trajectories from the nonrotated population (blue) to the trajectories that would have resulted from the rotated population if the perturbation had not been applied. (To compute this, we used the firing rates from the rotated population to construct a population vector with the decoding parameters from the control session.) In the early perturbation session, the nonrotated trajectory and the trajectory that the rotated population would have had, if not perturbed, overlap both in time (A) and in space (B). Late in the perturbation session, they overlap for the first 400 ms or so, and then they begin to diverge.

References

    1. Buonomano DV, Merzenich MM. Cortical plasticity: from synapses to maps. Annu Rev Neurosci. 1998;21:149–186. - PubMed
    1. Sanes JN, Donoghue JP. Plasticity and primary motor cortex. Annu Rev Neurosci. 2000;23:393–415. - PubMed
    1. Paz R, Wise SP, Vaadia E. Viewing and doing: similar cortical mechanisms for perceptual and motor learning. Trends Neurosci. 2004;27:496–503. - PubMed
    1. Siegelbaum SA, Kandel ER. Learning-related synaptic plasticity: LTP and LTD. Curr Opin Neurobiol. 1991;1:113–120. - PubMed
    1. Gandolfo F, Li CSR, Benda BJ, Padoa-Schioppa C, Bizzi E. Cortical correlates of learning in monkeys adapting to a new dynamical environment. Proc Natl Acad Sci USA. 2000;97:2259–2263. - PMC - PubMed

Publication types