. 2008 Dec;10(12):1481-92, 3p following 1492.
doi: 10.1593/neo.81004.

Variant HNF1 modulates epithelial plasticity of normal and transformed ovary cells

Affiliations
Free PMC article

Variant HNF1 modulates epithelial plasticity of normal and transformed ovary cells

Antonella Tomassetti et al. Neoplasia. 2008 Dec.
Free PMC article

Abstract

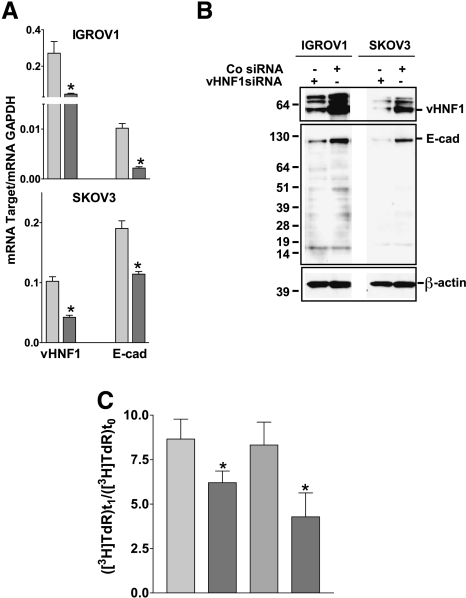
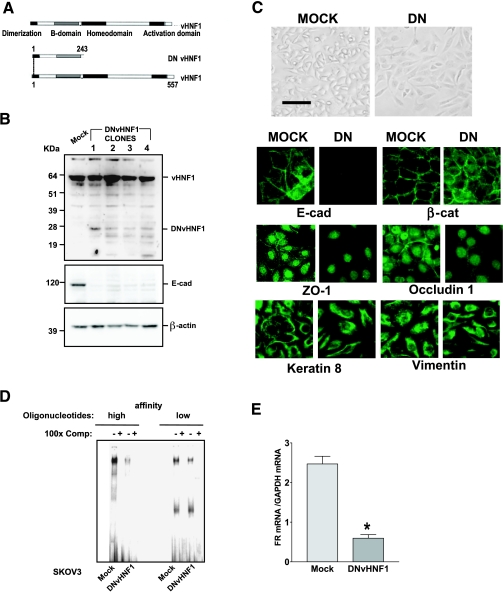
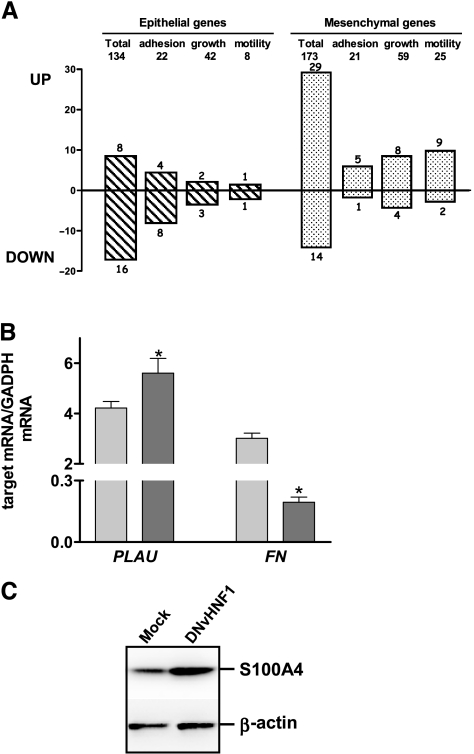
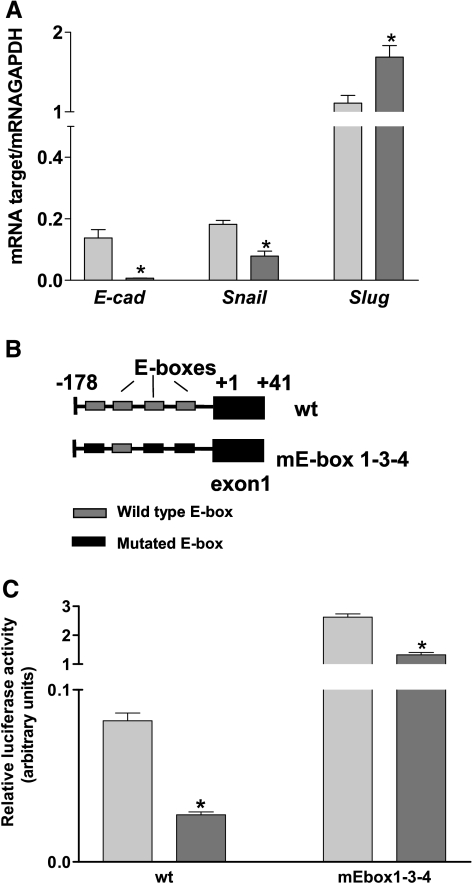
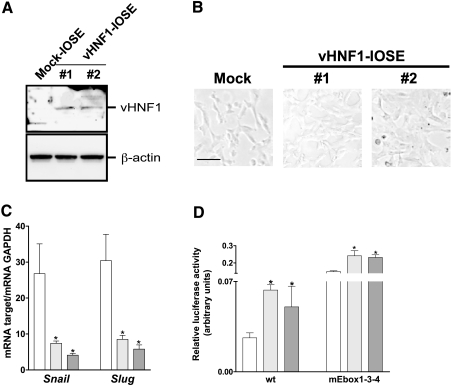
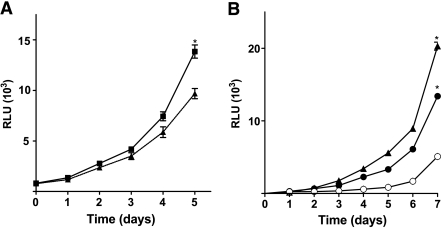
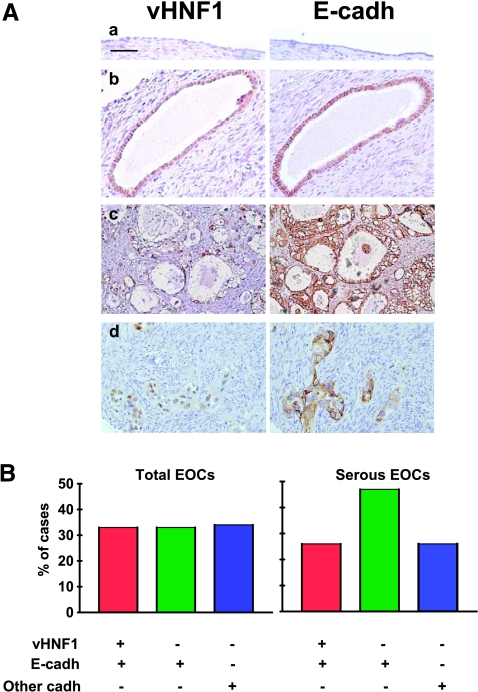
Ovarian carcinoma arises from the ovarian surface epithelium, which undergoes phenotypic changes characteristic of müllerian epithelium during the first stages of tumorigenesis. The variant isoform of the hepatocyte nuclear factor 1 (vHNF1) is a transcription factor involved in the development of tissues derived from the müllerian duct. Here, we show that vHNF1 knockdown in two ovarian carcinoma cell lines, SKOV3 and IGROV1, leads to reduced E-cadherin (E-cadh) expression and decreased proliferation rate. Accordingly, SKOV3 cells ectopically expressing a dominant-negative (DN) vHNF1 mutant undergo an epithelial-mesenchymal-like transition, acquiring a spindle-like morphology, loss of E-cadh, and disrupted cell-cell contacts. Gene expression profiling of DNvHNF1 cells on the basis of a newly compiled list of epithelial-mesenchymal transition-related genes revealed a correlation between vHNF1 loss-of-function and acquisition of the mesenchymal phenotype. Indeed, phenotypic changes were associated with increased Slug transcription and functionality. Accordingly, vHNF1-transfected immortalized ovarian surface epithelial cells showed down-regulation of Snail and Slug transcripts. In DNvHNF1-transfected SKOV3 cells, growth rate decreased, and in vHNF1-transfected immortalized ovarian surface epithelial cells, growth rate increased. By immunohistochemistry, we found a strong association of vHNF1 with E-cadh in clear cell and in a subset of serous carcinomas, data that could potentially contribute in distinguishing different types of ovarian tumors. Our results may help in understanding the biology of ovarian carcinoma, identifying early detection markers, and opening potential avenues for therapeutic intervention.


Figures

Figure 1
Figure 1
vHNF1 silencing impairs epithelial differentiation of ovarian tumor cells. IGROV1 and SKOV3 cells were treated with a vHNF1-specific siRNA. (A) Quantitative RT-PCR on total RNA extracts from cells treated with a control (light gray bar) or vHNF1-specific (dark gray bar) siRNA. Data represent mean (SD) for the vHNF1 and E-cadh genes normalized to the housekeeping gene GAPDH in at least six determinations. Asterisks indicate significant differences (P < .05). (B) In a parallel experiment, cells were lysed and analyzed by Western blot analysis with Abs against vHNF1 and E-cadh, respectively. Co siRNA indicates control siRNA. β-Actin was used for normalization of gel loading. One of three experiments is shown. (C) IGROV1 and SKOV3 cells were treated with a control (light gray bar) or a vHNF1-specific (dark gray bar) siRNA as in Figure 2, and proliferation was evaluated by incorporation of radiolabeled thymidine. Data are mean (SD) of six replicates; one of two experiments is shown. Asterisks indicate significant differences (P < .05).
Figure 2
Figure 2
vHNF1 loss-of-function impairs epithelial differentiation of ovarian tumor cells. (A) Schematic representation of wt vHNF1, with its functional domains, and the truncated DNvHNF1. Note that DNvHNF1 only maintains the N-terminal dimerization and B domains. (B) Western blot analysis of total cell lysates from Mock cells and DNvHNF1 clones was performed using a rabbit anti-HNF1 Ab. The 15- to 24-kDa bands in DNvHNF1 lysates might represent shorter DNvHNF1 products; β-actin was used for normalization of gel loading. (C) Upper panel: Morphology of Mock and DNvHNF1 cells. Cells were grown to confluence in six-well plates, and images were obtained by phase-contrast microscopy with a 10x objective. Bar, 100 µm. Lower panel: IF was performed on methanol-fixed Mock and DNvHNF1 cells with Abs against the molecules indicated. Images were obtained with a 40x objective. (D) Electrophoretic mobility shift assay of NEs prepared from Mock and DNvHNF1 cells was performed using two oligonucleotides containing the HNF1 consensus DNA-binding site and corresponding to the proximal elements of the sequences of the albumin (high affinity) and FR (low affinity) promoters, respectively. Specific DNA-protein complexes were competed with a 100-fold molar excess of unlabeled probes (100x Comp), as indicated. (E) Quantitative RT-PCR of the FR transcript using total RNA extracted from Mock and DNvHNF1 transfectants. Data represent mean (SD) for FR expression normalized to the housekeeping gene GAPDH in at least six determinations. Asterisk indicates a significant difference (P < .01).
Figure 3
Figure 3
vHNF1 loss-of-function induces a gene expression profile resembling that of EMT. (A) Upper panel: we compiled a list of specific epithelial (134) and mesenchymal (173) genes that are reported in Table W1. The number of genes in the largest functional classes is reported. Lower panel: we extracted the expression data for each gene of this EMT-related list from the DNvHNF1 versus Mock data sets. Epithelial (dashed bars) and mesenchymal (dotted bars) genes differentially expressed in DNvHNF1 versus Mock data sets. (B) Quantitative RT-PCR for target mRNA was performed with total RNA extracted from Mock (light gray bars) and DNvHNF1 (dark gray bars) cells. Data represent mean (SD) for the relevant genes normalized to the housekeeping gene GAPDH in at least six determinations. Asterisks indicate significant difference (P < .02). (C) Western blot analysis of total cell lysates from Mock and DNvHNF1 cells was performed using a rabbit anti-S100A4 Ab. β-Actin was used for normalization of gel loading. One of three gels is shown.
Figure 4
Figure 4
vHNF1 loss-of-function leads to Slug expression and functionality. (A) Quantitative RT-PCR for E-cadh, Snail, and Slug transcripts was performed on total RNA extracted from Mock (light gray bars) and DNvHNF1 (dark gray bars). Data represent mean (SD) for the genes indicated, after normalization to the housekeeping gene GAPDH in at least six determinations. Asterisks indicate significant differences (P ≤ .02). (B) Schematic representation of Chd1 proximal promoter containing four putative E-box sequences cloned upstream of the luciferase gene and transiently transfected in Mock and DNvHNF1 cells. Mutations within the E-boxes are as indicated. (C) Luciferase-promoter gene assay of Mock (light gray bars) and DNvHNF1 (dark gray bars) cells transiently transfected with reporter plasmids containing the wt Cdh1 proximal promoter or the same promoter with mutated E-box sequences (mEbox) as reported in panel B. Data are mean (SD) normalized for transfection efficiency in three independent experiments performed in triplicate. Asterisk indicates a significant difference (P ≤ .01).
Figure 5
Figure 5
Ectopic expression of vHNF1 in IOSE cells is sufficient to induce Snail and Slug. (A) Western blot analysis of total cell lysates from Mock and DNvHNF1-IOSE clones #1 and #2 was performed with a rabbit anti-vHNF1 Ab. (B) Morphology of Mock and DNvHNF1-IOSE cells. While Mock- and vHNF1-IOSE #1 showed a more spindle-like morphology, vHNF1-IOSE #2, which represents a clone grown in vitro for longer time than vHNF1-IOSE #1 cell line, appeared larger in size acquiring a more compacted morphology. Images were obtained by phase-contrast microscopy using a 10x objective. Bar, 100 µm. (C) Quantitative RT-PCR for Snail and Slug transcripts was performed on total RNA extracted from Mock (white bar) and vHNF1-IOSE #1 (light gray bars) and #2 (dark gray bars) cells. Data represent mean (SD) for the relevant genes normalized to the housekeeping gene GAPDH in at least six determinations. Asterisks indicate significant differences (P ≤ .05). (D) Luciferase-promoter gene assay using Mock (white bar) and DNvHNF1-IOSE #1 (light gray bars) and #2 (dark gray bars) cells transiently transfected with promoter reporter plasmids containing the wt Cdh1 proximal promoter or the same promoter with mutations in the E-box sequences (mEbox) as reported in Figure 4B.
Figure 6
Figure 6
vHNF1 modulates the proliferative potential of ovarian cancer and normal cells. Cells were seeded in 96-well plates, and growth was measured for up to 5 to 7 days with a CellTiter-Glo luminescent cell viability assay kit (Promega). (A) Mock (▪) and DNvHNF1 (▴): data represent mean (SD) of six determinations from three independent experiments. (B) Mock (○) and vHNF1-IOSE #1 (●) and #2 (▴): data represent mean (SD) of five determinations from one of three experiments. Asterisks indicate significant differences (P ≤ .05).
Figure 7
Figure 7
vHNF1 is expressed in a subset of normal and transformed E-cadh-expressing ovarian cells. Immunohistochemical analyses with anti-vHNF1 and -E-cadh Abs on paraffin-embedded normal and tumor-derived ovarian tissues. The immunohistochemical analysis is also reported in Table 2. (A) Representative examples of normal ovarian epithelium (a), an inclusion cyst (b), and two serous EOCs (c and d). Images were obtained with a 20x objective. Bar, 100 µm. (B) Epithelial ovarian carcinomas analyzed for vHNF1 and/or E-cadh expressions. Anti-E-cadh-negative samples comprise other cadh-expressing tumors. Total number of EOCs, n = 38; total number of serous EOCs, n = 19. Vertical bars, percentage of immunoreactive samples.

References

    1. Shih IeM, Kurman RJ. Ovarian tumorigenesis: a proposed model based on morphological and molecular genetic analysis. Am J Pathol. 2004;164:1511–1518. - PMC - PubMed
    1. Bell DA. Origins and molecular pathology of ovarian cancer. Mod Pathol. 2005;18(Suppl 2):S19–S32. - PubMed
    1. Auersperg N, Wong AS, Choi KC, Kang SK, Leung PC. Ovarian surface epithelium: biology, endocrinology, and pathology. Endocr Rev. 2001;22:255–288. - PubMed
    1. Strumane K, Van Roy F, Berx G. The role of E-cadherin in epithelial differentiation and cancer progression. Recent Res Devel Cell Biochem. 2003;1:33–37.
    1. Richmond PJM, Karayiannakis AJ, Nagafuchi A, Kaisary AV, Pignatelli M. Aberrant E-cadherin and α-catenin expression in prostate cancer: correlation with patient survival. Cancer Res. 1997;57:3189–3193. - PubMed

Publication types

Substances