. 2008 Dec 9;105(49):19372-7.
doi: 10.1073/pnas.0809966105. Epub 2008 Dec 2.

Genomic alterations link Rho family of GTPases to the highly invasive phenotype of pancreas cancer

Affiliations

Genomic alterations link Rho family of GTPases to the highly invasive phenotype of pancreas cancer

Alec C Kimmelman et al. Proc Natl Acad Sci U S A. .

Abstract

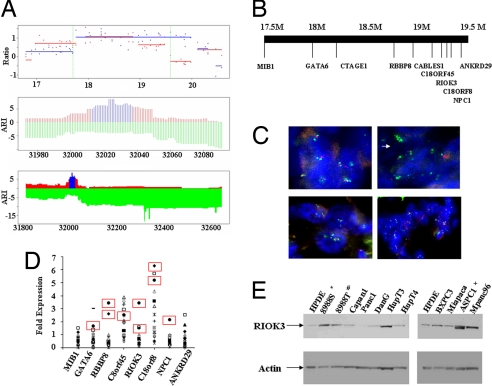
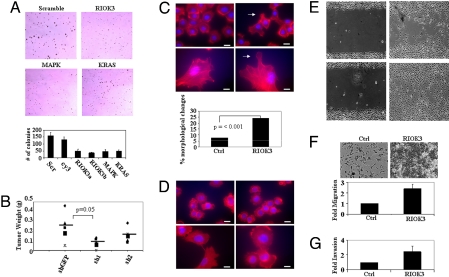
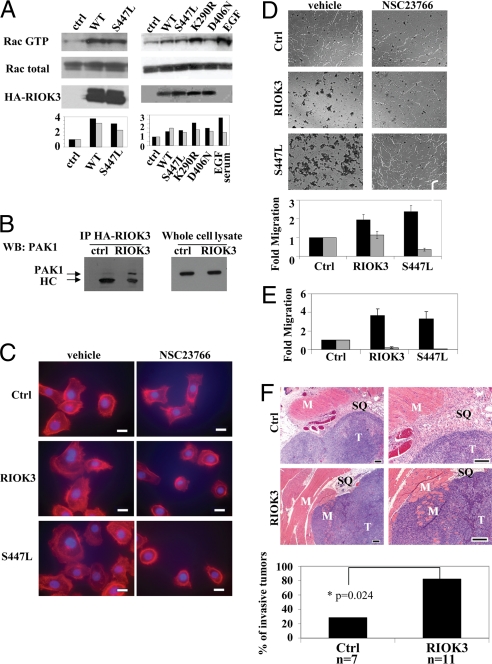
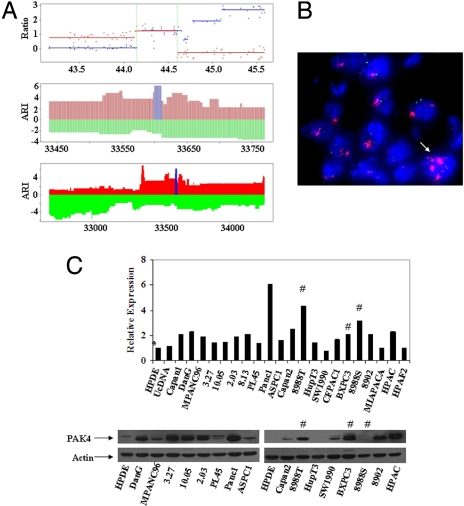
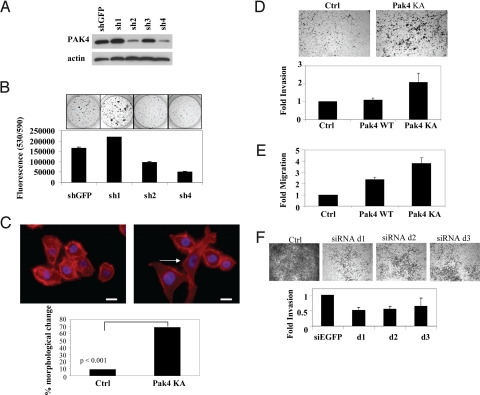
Pancreas ductal adenocarcinoma (PDAC) is a highly lethal cancer that typically presents as advanced, unresectable disease. This invasive tendency, coupled with intrinsic resistance to standard therapies and genome instability, are major contributors to poor long-term survival. The genetic elements governing the invasive propensity of PDAC have not been well elucidated. Here, in the course of validating resident genes in highly recurrent and focal amplifications in PDAC, we have identified Rio Kinase 3 (RIOK3) as an amplified gene that alters cytoskeletal architecture as well as promotes pancreatic ductal cell migration and invasion. We determined that RIOK3 promotes its invasive activities through activation of the small G protein, Rac. This genomic and functional link to Rac signaling prompted a genome wide survey of other components of the Rho family network, revealing p21 Activated Kinase 4 (PAK4) as another amplified gene in PDAC tumors and cell lines. Like RIOK3, PAK4 promotes pancreas ductal cell motility and invasion. Together, the genomic and functional profiles establish the Rho family GTP-binding proteins as integral to the hallmark invasive nature of this lethal disease.


Conflict of interest statement

The authors declare no conflict of interest.

Figures

Fig. 1.
Fig. 1.
Analysis of the 18q11 minimal common region. (A) (Top) Minimum common region (within green dotted lines) of the RIOK3 amplicon in two tumors, in blue and red. Dots are normalized log2 ratio for each probe; lines are segmented log2 ratios in the region. (Middle) expanded region on chromosome 18 showing ARI (Abberation Recurrence Index, a summation of log2 ratios from all samples for each probe) for both amplification/gain and deletion/loss with the probe index on the x-axis. (Bottom) ARI for whole chromosome 18. (B) Schematic of the minimal 18q11.2 amplicon (C) Tumor microarray fluorescence in situ hybridization (TMA-FISH) using a probe within the amplified genomic region labeled with FITC (green) and centromere reference probe with Cy3 (red). Amplification is indicated by an increase in ratio of green to red signals. Shown are four different tumor cores with amplification. White arrow shows a nucleus with increased signal. (D) quantitative real time PCR (qRT-PCR) was performed with 20 PDAC cell lines and a human pancreatic ductal cell line as a reference. The x-axis shows the resident genes and relative expression is on the y-axis. The two lines that harbor the 18q amplicon (8988T and 8988S) are boxed in cases of overexpression. (E) Western blot confirming RIOK3 overexpression in pancreatic tumor lines. (HPDE, human pancreatic ductal cells).
Fig. 2.
Fig. 2.
Functional analysis of RIOK3 in PDAC and immortalized human pancreatic ductal cells. (A) 8988T cells were transfected with two different siRNAs for RIOK3 (a and b) and controls (scrambled or a cy3 labeled control) and seeded into semisolid agar. Note the significant reduction of colonies of significant size as well as that of the KRAS and MAPK siRNAs when compared with the control scrambled siRNA (quantitation below). (B) 8988T cells transduced with RIOK3 shRNAs were injected s.c. into the flanks of nude mice. Tumor weights were plotted for each cohort. Horizontal lines represent the mean weight for the cohort. Xenografts derived from cells with highly efficient knockdown of RIOK3 (sh1) demonstrated a greater reduction in weight as compared with that with a less robust knockdown (sh2) and that of control tumors (shGFP) (P = 0.05; t test). (C) Top right image depicts immortalized human pancreatic ductal cells that have enforced expression of RIOK3 and are stained with rhodamine conjugated phalloidin to visualize the actin cytoskeleton. Note the change in cell morphology as compared with control cells (top left), particularly in the larger flattened morphology and development of membrane protrusions (white arrow). The lower images show a similar phenomenon in immortalized MEFs (right image, with enforced RIOK3 expression). White bar, 5 μm. Histogram shows the quantitation of the number of pancreatic ductal cells with morphological changes with an increase as compared with control (P < 0.001; Fisher Exact Test). (D) 8988T cells were transduced with a lentiviral shRNA for RIOK3. The top 2 images show the normal morphology of control (shGFP) infected cells. The bottom two images depict cells with RIOK3 knock down. As shown, these cells have a more flattened, enlarged shape with a decrease in cytoplasmic protrusions. White bar, 5 μm. (E) A scratch assay using pancreatic ductal cells either expressing a control vector (Top) or RIOK3 (Bottom) showing increased closure of the scratched area in the RIOK3 expressing cells. (F) These same cells were used in transwell migration assays, showing increased cell migration in ductal cells with enforced RIOK3 expression, which has been quantified in the graph below and expressed as fold of control cells. (G) Data from a representative experiment, showing RIOK3 increases cell invasion in Matrigel coated wells compared with control ductal cells.
Fig. 3.
Fig. 3.
RIOK3 activates the small GTPase, Rac1. (A) 293T cells were transfected with the indicated plasmids and Rac activation assays were performed. The top panel shows the active (GTP-bound) fraction of Rac1 with increased amounts in cells transfected with various RIOK3 constructs compared with the control. Cells were triggered with serum or EGF as a positive control (last lane). Total Rac1 expression (Middle) and RIOK3 (Lower) are shown as well. Histograms are shown below showing GTP-Rac normalized to total Rac expression by densitometric analysis and expressed as fold of control. The results from separate experiments are depicted (Left and Right). Black and gray bars show results from two representative assays. (B) Immunoprecipitation (IP) for HA-RIOK3 in 293T cells either transfected with HA-RIOK3 or a control plasmid. Western blotting was performed for endogenous PAK1. The blot on the left shows the IP and the right shows whole cell lysate demonstrating the expression of endogenous PAK1. Note the enrichment of PAK1 that is brought down in the RIOK3 transfected cells. HC, Ig heavy chain. (C) RIOK3-expressing human pancreatic ductal cells were stained with phalloidin showing RIOK3 induced membrane changes. Cells were treated with the Rac1 inhibitor NSC23766 (100 μM) before staining (right column). These cells showed reversion of morphology to that of the parental cells, with decreased membrane ruffling and decrease in cell size. White bar, 5 μm. (D) Transwell migration assays were performed with the ductal cells as described previously. Cells were pretreated with 50 μM NSC23766 and the assay was performed in the presence of the inhibitor. Inhibition of Rac1 decreased the RIOK3 induced migration of the cells (right column). This is quantified below with black bars (untreated cells) and gray bars (NSC23766) and expressed as fold of control. (E) Similar results were obtained in cells coexpressing a dominant negative mutant of Rac1 (RacN17). (F) Panc1 cells, which express low levels of RIOK3 were transduced with RIOK3 expression plasmids and injected into the flanks of immunocompromised mice. Tumors were dissected en bloc when they reached ≈1 cm in greatest dimension. The ability of the tumors (T) to invade from the s.c. tissue (SQ) into the underlying muscle (M) was assessed histologically on H&E slides. The top panels show a tumor derived from control Panc1 cells that remains confined in the s.c. tissues at lower and higher magnification (scale bar, 200 μm). The bottom panels show a tumor from RIOK3 overexpressing cells that has invaded into the surrounding muscle. The graph below shows that there is a statistically significant increase in the number of tumors that show muscle invasion in the RIOK3 over expressing tumors (P = 0.024, Fisher Exact Test) as compared with tumors from control cells.
Fig. 4.
Fig. 4.
PAK4 is amplified and overexpressed in PDAC. (A) (Top) Minimum common region (within green dotted lines) of the PAK4 amplicon in one tumor and one cell line, in blue and red. Dots are normalized log2 ratio for each probes; lines are segmented log2 ratios in the region. (Middle) Expanded region on chromosome 19 showing ARI (as above) for both amplification/gain and deletion/loss. (Bottom) ARI for whole chromosome 19. (B) TMA-FISH using a probe within the PAK4 amplicon labeled with Cy3 (red) and a centromere reference probe labeled with FITC (green). Amplification is indicated by an increase in ratio of red to green signals. Shown is a representative tumor core with amplification. White arrow shows a nucleus with increased signal. (C) qRT-PCR was performed with a panel PDAC cell lines and human pancreatic ductal cell line as a reference to determine the relative expression of PAK4 across the lines. Results are expressed as fold over control (ductal cells marked by the asterisks). Those with genomic amplification of this region (depicted by pound symbols) all show marked overexpression. Western blot for PAK4 expression is shown below.
Fig. 5.
Fig. 5.
Knockdown and overexpression of PAK4 reveals a potential role in PDAC biology. (A) Western blot analysis showing knockdown of PAK4 expression with various shRNAs (top) with corresponding actin loading control (bottom). (B) Results from soft agar assays showing significant reduction in number of colonies with PAK4 suppression by shRNAs in 8988T cells. Results are quantified below, showing reduction in colony number as determined by Alamar blue staining and fluorescence intensity. (C) Human pancreatic ductal cells expressing activated Pak4 were fixed and stained with phalloidin, as described previously. The left image depicts control cells, whereas the right image shows an example of an elongated cell (white arrow) in cells expressing the activated PAK4. White bar, 5 μm. The histogram shows a statistically significant difference (Fisher Exact Test) in the number of elongated cells in the activated PAK4 cells compared with control cells. (D) Ductal cell lines expressing activated or wild-type PAK4 were used for transwell migration assays. Depicted here is an increase in cell invasion with activated PAK4 cells (KA) shown on the right, compared with control cells (left). Results are quantified below and expressed as fold of control. (E) Similar experiments performed in uncoated wells show an increase in cell migration. (F) 8988T cells were transfected with siRNAs directed to PAK4 and invasion assays were performed. All three duplexes show significant reduction in invasion compared with control cells transfected with a control siRNA (GFP) and are quantified below (expressed as fold of control).

References

    1. Li D, Xie K, Wolff R, Abbruzzese JL. Pancreatic cancer. Lancet. 2004;363:1049–1057. - PubMed
    1. Ghaneh P, Costello E, Neoptolemos JP. Biology and management of pancreatic cancer. Gut. 2007;56:1134–1152. - PMC - PubMed
    1. Hezel AF, Kimmelman AC, Stanger BZ, Bardeesy N, Depinho RA. Genes Dev. 2006;20:1218–1249. - PubMed
    1. Aguirre AJ, et al. High-resolution characterization of the pancreatic adenocarcinoma genome. Proc Natl Acad Sci. 2004;101:9067–9072. - PMC - PubMed
    1. Heidenblad M, et al. Genome-wide array-based comparative genomic hybridization reveals multiple amplification targets and novel homozygous deletions in pancreatic carcinoma cell lines. Cancer Res. 2004;64:3052–3059. - PubMed

Publication types

MeSH terms