. 2008 Nov;15(9):866-77.
doi: 10.1177/1933719108322425.

Profiling gene expression in human placentae of different gestational ages: an OPRU Network and UW SCOR Study

Affiliations

Profiling gene expression in human placentae of different gestational ages: an OPRU Network and UW SCOR Study

Andrei M Mikheev et al. Reprod Sci. 2008 Nov.

Abstract

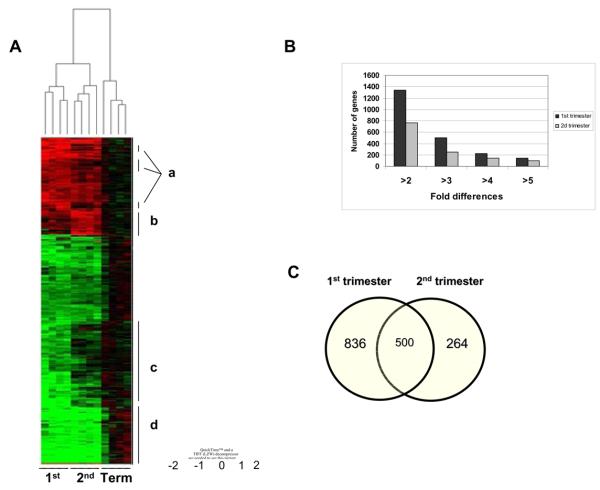
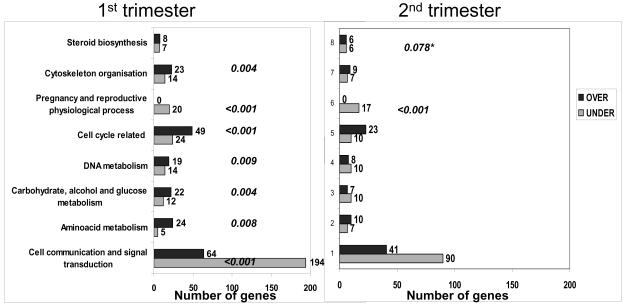
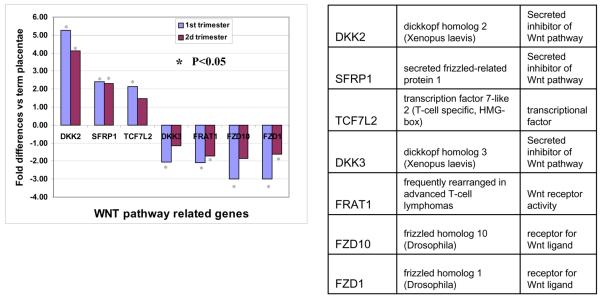
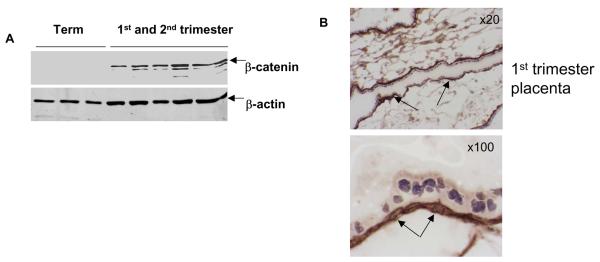
We used the whole-genome approach to identify major functional categories of genes whose expression depends on gestational age. Using microarray analysis, we compared gene expression profiles in the villous tissues of first (45-59 days) and second trimester (109-115 days) placentae with C-section term placentae. We found that in first trimester placentae, genes related to cell cycle, DNA, amino acids, and carbohydrate metabolism were significantly overrepresented, while genes related to signal transduction were underrepresented. Among genes involved in organism defense, we identified genes involved in chemical response, metabolism, and transport. Analysis of signal transduction pathways suggested, and subsequently confirmed independently, that the Wnt pathway was changed with gestational age leading to inhibition of beta-catenin protein expression. Our study will serve as a reference database to gain insight into the regulation of gene expression in the developing placentae and to compare with gene expression in placentae from complicated pregnancies.


Figures

Figure 1
Figure 1
A. Unsupervised hierarchical clustering of genes in placentae of different gestational age using average correlation linkage analysis. Cluster has been built using genes that demonstrated at least 2 fold differential expression in 1st and 2nd trimester compared to term placentae and p<0.05. Each placental sample is represented by an individual branch on the top of the panel. The branches cluster together by gestational age. The average expression value for term placentae samples for a given gene was used as the reference point and is shown in black. Genes overexpressed relative to average expression value of term placentae are shown in red. Genes expressed lower to relative average expression value of term placentae are shown in green. Subclusters of genes that demonstrated predominant differences in the levels of expression in the 1st and/or 2nd trimester placentae vs term placentae are shown with vertical lines and the corresponding letter (a-d). B. Number of genes whose expression between 1st trimester vs. term or 2nd trimester vs. term or both vs. term is different by at least two-fold (p<0.05).
Figure 2
Figure 2
Top 7 GeneOntology categories identified in 1st and 2nd trimester using GoMiner software to determine enriched groups of differentially expressed genes. Categories united by common functional theme are shown on the left. Number of genes overexpressed (over) or underexpressed (under) in 1st trimester (left panel) or 2nd trimester (right panel) placentae vs term placentae are shown. Computed False Discovery Rate (FDR) below cut-off level (0.1) for each over or underexpressed group of genes is shown in italics next to the each bar. FDR values that did not meet cut-off levels are not shown. *-FDR is for group of genes related to steroid biosynthesis that demonstrated balanced change (number of upregulated genes is equal to number of downregulated genes) in 2nd trimester vs term placentae.
Figure 3
Figure 3
Differential regulation of genes related to canonical Wnt pathway in 1st and 2nd trimester placentae versus term placentae. A. The fold-difference and direction of change in Wnt pathway gene expression vs. term placenta. *-significant (p<0.05) compared to term placentae. Gene names and function are shown in the table.
Figure 4
Figure 4
A. Reduced levels of β-catenin expression in term placentae compared to 1st or 2nd trimester placentae. The β-catenin expression is detectable in term placentae after longer exposure (not shown). Lower panel shows levels of β-actin expression used for normalization of the Western blot. B. Immunohistochemical analysis shows that β-catenin in 1st (panel a) and 2nd trimester placentae (panel b) is highly expressed in the nuclei and cytoplasm of cytotrophoblasts (shown with long arrows) and to a lesser extent in the cytoplasm of syncytiotrophoblasts (higher magnification, panel d, shown with short arrows). Very weak signal for β-catenin is also detected in the nuclei of at least some syncytiotrophoblasts (panel d, dashed arrows). In the term placentae β-catenin is detected only in the mesenchymal compartment (panels e and f, shown with arrowheads) while in epithelial component β-catenin is undetectable. Panel c shows 1st trimester placentae processed for immunohistochemical staining with primary antibody omitted, C. Confocal images of the 1st trimester placentae stained with β-catenin antibody and visualized with secondary antibody conjugated with AlexaFluor 568. Nuclei were stained with DAPI (1 ug/ml) and presented as green pseudo-color for better contrast (left panel). In the cytotrophoblasts (solid arrows) β-catenin (red) is clearly localized in the nuclei as demonstrated in the z-stack images (right panel). In the syncytiotrophoblasts β-catenin is localized in the cytoplasm. Weak β-catenin signal is also detected in the nuclei of some syncytiotrophoblasts (dashed arrow). Scale bar = 22 um.

References

    1. Cross JC. Placental function in development and disease. Reproduction, Fertility, & Development. 2006;18:71–76. - PubMed
    1. Pardi G, Cetin I. Human fetal growth and organ development: 50 years of discoveries. American Journal of Obstetrics & Gynecology. 2006;194:1088–1099. - PubMed
    1. Unadkat JD, Dahlin A, Vijay S. Placental drug transporters. Current Drug Metabolism. 2004;5:125–131. - PubMed
    1. Carney EW, Scialli AR, Watson RE, DeSesso JM. Mechanisms regulating toxicant disposition to the embryo during early pregnancy: an interspecies comparison. Birth Defects Research Part C, Embryo Today: Reviews. 2004;72:345–360. - PubMed
    1. Irizarry RA, Hobbs B, Collin F, Beazer-Barclay YD, Antonellis KJ, Scherf U, Speed TP. Exploration, normalization, and summaries of high density oligonucleotide array probe level data. Biostatistics. 2003;4:249–264. - PubMed

Publication types