. 2008 Dec 3;28(49):13094-105.
doi: 10.1523/JNEUROSCI.3074-08.2008.

Activity-dependent dynamic microtubule invasion of dendritic spines

Affiliations

Activity-dependent dynamic microtubule invasion of dendritic spines

Xindao Hu et al. J Neurosci. .

Abstract

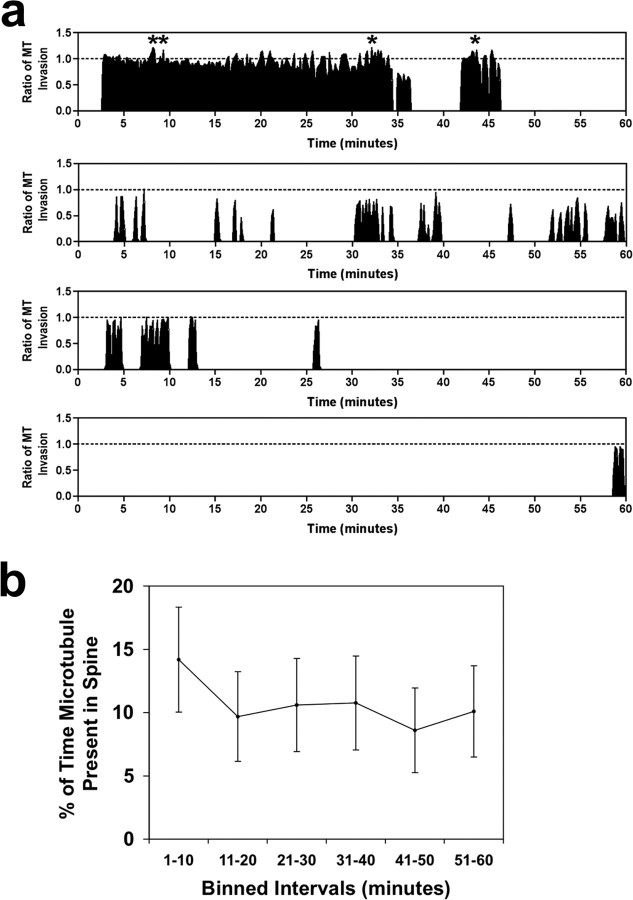
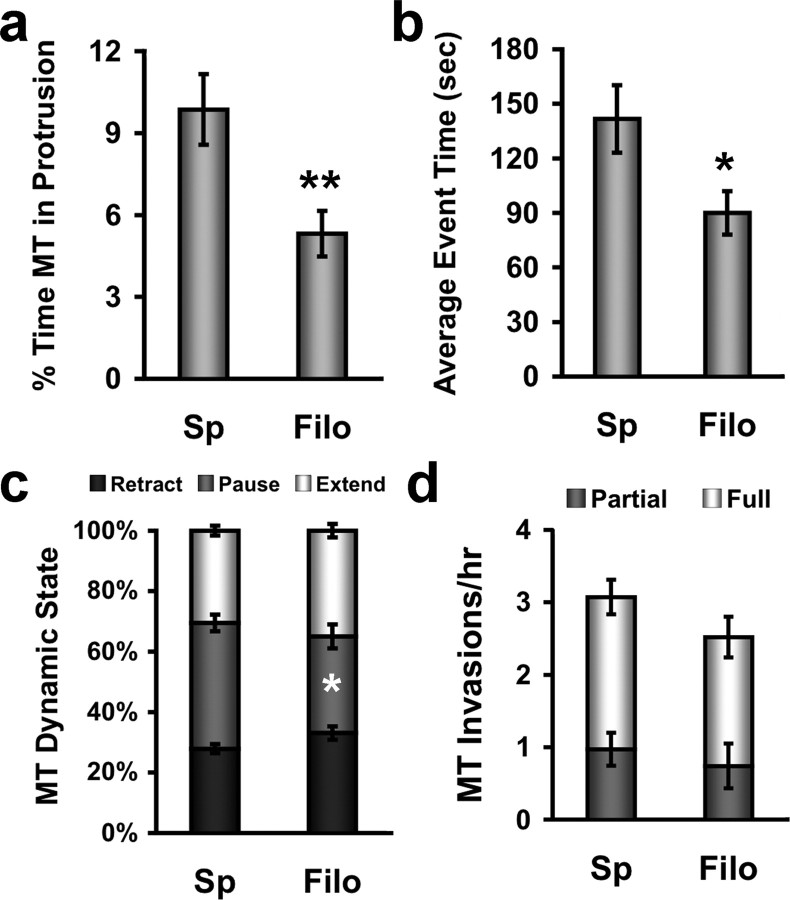
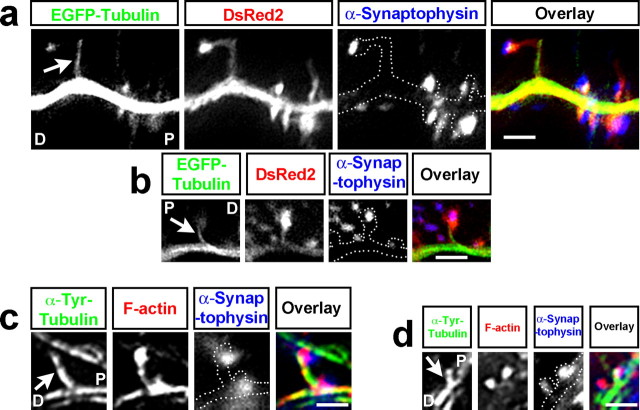
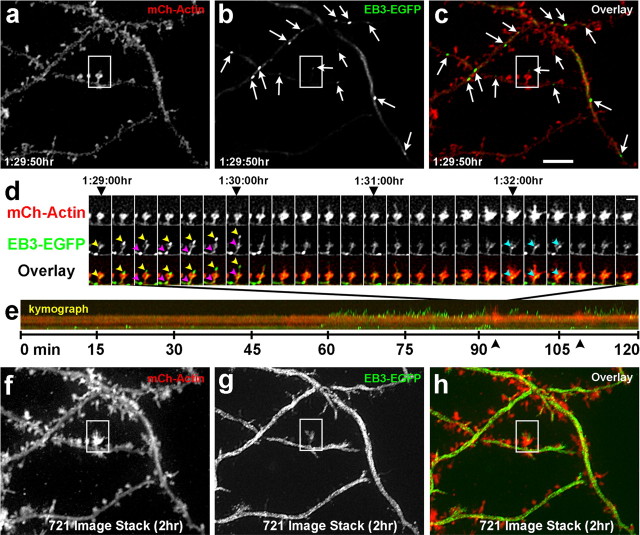
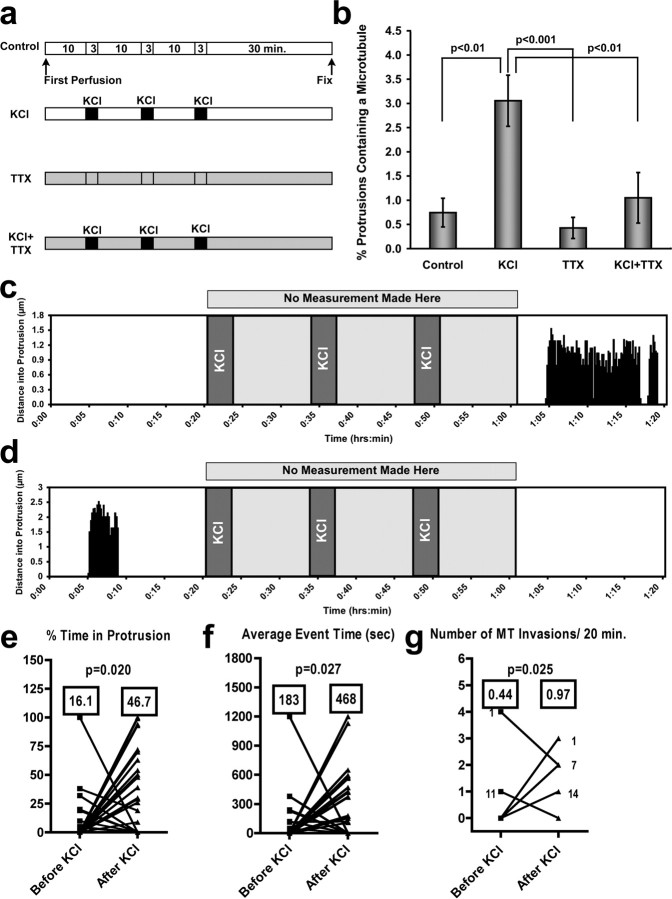
Dendritic spines are the primary sites of contact with presynaptic axons on excitatory hippocampal and cortical neurons. During development and plasticity spines undergo marked changes in structure that directly affect the functional communication between neurons. Elucidating the cytoskeletal events that induce these structural changes is fundamental to understanding synaptic biology. Actin plays a central role in the spine cytoskeleton, however the role of microtubules in spine function has been studied little. Although microtubules have a prominent role in transporting material throughout the dendrite that is destined for spines, they are not thought to directly influence spine structure or function. Using total internal reflectance fluorescent microscopy we discovered that microtubules rapidly invade dendritic protrusions of mature CNS neurons (up to 63 d in vitro), occasionally being associated with marked changes in spine morphology in the form of transient spine head protrusions (tSHPs). Two microtubules can occupy a spine simultaneously and microtubule targeting can occur from both the proximal and distal dendrite. A small percentage of spines are targeted at a time and all targeting events are transient, averaging only a few minutes. Nevertheless, over time many spines on a dendrite are targeted by microtubules. Importantly, we show that increasing neuronal activity enhances both the number of spines invaded by microtubules and the duration of these invasions. This study provides new insight into the dynamics of the neuronal cytoskeleton in mature CNS neurons and suggests that microtubules play an important, direct role in spine morphology and function.


Figures

Figure 1.
Figure 1.
Two microtubules can occupy a spine and induce transient spine head protrusions. Widefield (WF) (a–c) and total internal reflection fluorescent (TIRF) (e–g) images of a DIV 20 hippocampal neuron transfected with DsRed2 (a, e) and EGFP-α-tubulin (b, f) at the time of plating. Overlay images of WF (c) and TIRF (g) images with DsRed2 in red and EGFP-tubulin in green. d, DIC image of same region. h, DIC image merged with TIRF overlay image (g). i, Montage of images (∼4 min) from a 1 h TIRF time-lapse of the spine outlined by the white box (in e–h). This spine is targeted by two different microtubules during the time interval shown in the montage. i, The distal extent of each microtubule is demarcated by green and magenta arrowheads (in the EGFP-tubulin row). The entry of the first microtubule (green arrowheads) coincides with a transient spine head protrusion (tSHP) (52:45–53:55 min). The first microtubule (green arrowheads) depolymerizes (53:35–54:05 min) as the second microtubule polymerizes into the spine (53:35–55:06). j, A kymograph constructed from a five pixel wide line drawn through the extent of the spine and tSHP (k). The kymograph line (k) is linearized and compiled horizontally for each frame (10 s interval) of the 1 h time-lapse (361 frames). Time is indicated on the x-axis and distance is indicated on the y-axis. White arrows in j mark the beginning of separate microtubule excursions (events) into the spine and the tSHP is indicated by the yellow arrow. l, Graph plotting changes in spine area for the spine shown in e–k and microtubule invasions into that spine. MT invasion ratios were calculated by taking the ratio of the length of MT invasion into the protrusion divided by the protrusion length (DsRed2 channel). A protrusion ratio of 1.0 indicates the MT extended to the tip of the protrusion. Numbers >1.0 indicate the formation of a transient spine head protrusion (tSHP) in which the length to the distal tip of the spine head proper is used as the denominator. Scale bar is 5 μm in h and 2 μm in the last DsRed2 frame of i.
Figure 2.
Figure 2.
Microtubules invade spines consistently over 1 h of imaging. a, Representative graphs of MT entry into spines as a function of time. The x-axis is time (0–60 min) and the y-axis is the ratio of invasion (0.0–1.0, except during tSHPs in which values vary from 1.10 to 1.22 for examples shown here). The asterisks above the invasions in the first graph indicate tSHPs. b, Cumulative plot of all MT invasions from 69 spines (binned in 10 min intervals). Error bars are ± SEM. There was neither a difference between any of the data points over the 1 h imaging interval (p = 0.567, repeated measures ANOVA) nor a linear trend over time (p = 0.189, post test for linear trend).
Figure 3.
Figure 3.
Microtubules remain in spines longer and pause more than in stable filopodia. a, Bar graph showing the average percentage of time microtubules are present in protrusions during a 1 h interval (only spines invaded by MTs were quantified). Microtubules spend a significantly longer time in spines (Sp) than in stable filopodia (Filo) (**p < 0.01, Student's t test with Welch's correction). b, Bar graph showing the average time a microtubule spends in a protrusion for each event (excursion). Microtubules spend a significantly longer amount of time per excursion in spines compared with filopodia (*p < 0.05, Student's t test with Welch's correction). c, Stacked bar graph showing the percentage of time microtubules spend retracting, pausing and extending while present in spines and filopodia. Microtubules in spines spend a significantly longer time in the paused state than MTs in filopodia (*p < 0.05, Student's t test with Welch's correction). d, Bar graph showing the number of partial and full microtubule invasions into spines and filopodia per hour do not differ significantly. (n = 69 spines, n = 23 filopodia, from DIV 20–28 hippocampal neurons).
Figure 4.
Figure 4.
Microtubules (EB3-labeled) enter spines from both the proximal and distal dendrite in a cortical neuron (DIV 12). a, An example of anterograde MT polymerization into a dendritic protrusion. An EB3-EGFP punctum (yellow arrowhead) starts to polymerize in the proximal dendritic shaft (P) (0:15–0:25 min), turns into the protrusion (0:30 min), and polymerizes to the tip of the protrusion (0:40 min). Another MT (magenta arrowhead) polymerizes in the dendrite shaft proximal to the first MT but does not enter the protrusion (0:50–1:05 min). The first MT polymerizes again while in the protrusion (0:55–1:00 min). b, An example of retrograde MT polymerization in the same dendritic region as a. An EB3-EGFP punctum (green arrowhead) begins to polymerize in the distal dendrite shaft (D) (6:00–6:25 min), turns into a different protrusion (6:30 min) and polymerizes toward the spine head (6:30–6:40 min) but does not reach it (6:45 min). A second MT (cyan arrowhead) polymerizes retrogradely entirely within the dendrite shaft. Time is in minutes:seconds. Scale bar, 5 μm.
Figure 5.
Figure 5.
EGFP-labeled and endogenous microtubules target spines from both proximal and distal dendritic regions. a, b, Two examples of 20 DIV hippocampal neurons transfected with EGFP-tubulin (green in overlay) and DsRed2 (red in overlay), fixed and stained with an antibody to synaptophysin (blue in overlay), and imaged with wide field microscopy. The DsRed2 image was traced and the tracing was added to the anti-synaptophysin panels to show where the presynaptic endings were in relation to the dendrite. In a, the microtubule is entering the spine from the proximal dendrite (P), whereas the microtubule in b is entering from the distal dendrite (D). c, d, Two examples of spines from untransfected 20 DIV hippocampal neurons that were labeled with an antibody to tyrosinated tubulin (to label dynamic MTs; green in overlay image), phalloidin (to stain filamentous actin; red in overlay image), and an antibody to synaptophysin (blue in overlay image) and imaged in TIRFM. In c, the microtubule is entering the spine from the proximal dendrite (P), whereas the microtubule in d is entering from the distal dendrite (D). Arrows in a–d point to microtubules that are present in spines at the time of fixation. Scale bars: a–d, 2 μm.
Figure 6.
Figure 6.
Microtubules remain dynamic throughout the life of the neuron and continue to invade dendritic spines. Fluorescent images of a DIV 63 hippocampal neuron transfected with mCherry-β-actin (a) and EB3-EGFP (b) at the time of plating. Arrows in b and c point to EB3 puncta (polymerizing MTs). c, An overlay image of the mCherry-β-actin (red) and EB3-EGFP (green) images. d, A montage of a single spine (boxed in a–c) from 1:29:00 to 1:32:50 h in the 2 h sequence. One MT polymerizes into the spine (yellow arrowheads point to an EB3-EGFP punctum in both the EB3-EGFP and overlay rows) in association with a tSHP and extends to its tip. Another MT (magenta arrowheads point to a second EB3-EGFP punctum) polymerizes into the spine behind the first MT but only extends to the spine head. A third MT (cyan arrowheads) extends into the head of the spine (1:32:00–1:32:20) during the time the actin becomes markedly dynamic (1:31:10–1:32:40), forming transient filopodia and lamellipodia. e, Kymograph of the entire 2 h sequence showing no MT activity during the first hour but multiple MT excursions (short green lines) interspersed by dramatic actin-based protrusions (black arrowheads) during the second hour. f–h, Same regions as in a–c except that these images are composites of all 721 images in the 2 h time lapse stacked into one image to show movement of actin and EB3. Note that there is so much activity of MTs in the dendrite shafts that they appear white, whereas a single frame shows only bright dots with some background of free EB3 (b). Scale bars: (in c) a–c, f–h, 5 μm; (in d, last mCh-actin image) d, e, 2 μm.
Figure 7.
Figure 7.
Global activity increases microtubule invasions of dendritic protrusions. a, Diagram depicting the perfusion protocols used for 75 mm KCl stimulation of global neuronal activity in DIV 21 hippocampal cultures. TTX was included at 1 μm. b, Graph of the percentage of protrusions containing a MT at the time of fixation. KCl treatment induced a substantial increase in the percentage of protrusions containing a MT. TTX addition to the perfusate abolished this increase. p values are shown (Kruskal–Wallis test with Dunn's post hoc tests). Control, TTX and KCl+TTX were not significantly different (p > 0.05). c, d, Two examples from 34 protrusions (from hippocampal neurons transfected with EGFP-α-tubulin and DsRed2) that were imaged before, during, and after three consecutive 75 mm KCl treatments. One graph (c) shows an example of one without MT invasion before KCl application and substantial MT invasion after, whereas the second graph (d) shows MT invasion before KCl application and no MT invasion after. e–g, Graphs quantifying the population of protrusions exhibiting either MT invasion before or after KCl treatment (all p values computed with Student's t test). Protrusions that showed no MT invasion before or after KCl were not quantified. e, MTs are present in protrusions for a significantly higher percentage of time (p = 0.020) after KCl treatment (means are shown in boxes). f, The average time a MT spends in a protrusion during one polymerization/depolymerization event is significantly longer after KCl treatment (p = 0.027). g, The number of MT invasions increased significantly after KCl treatment (p = 0.025). All statistics for e–g were calculated with the two-tailed Wilcoxon signed rank test.

References

    1. Alvarez VA, Sabatini BL. Anatomical and physiological plasticity of dendritic spines. Annu Rev Neurosci. 2007;30:79–97. - PubMed
    1. Baas PW, Deitch JS, Black MM, Banker GA. Polarity orientation of microtubules in hippocampal neurons: uniformity in the axon and nonuniformity in the dendrite. Proc Natl Acad Sci U S A. 1988;85:8335–8339. - PMC - PubMed
    1. Bourne J, Harris KM. Do thin spines learn to be mushroom spines that remember? Curr Opin Neurobiol. 2007;17:381–386. - PubMed
    1. Calabrese B, Wilson MS, Halpain S. Development and regulation of dendritic spine synapses. Physiology (Bethesda) 2006;21:38–47. - PubMed
    1. Chapleau CA, Carlo ME, Larimore JL, Pozzo-Miller L. The actions of BDNF on dendritic spine density and morphology in organotypic slice cultures depend on the presence of serum in culture media. J Neurosci Methods. 2008;169:182–190. - PMC - PubMed

Publication types

MeSH terms