. 2008 Dec 3;28(49):13341-53.
doi: 10.1523/JNEUROSCI.1421-08.2008.

Transcriptional upregulation of Cav3.2 mediates epileptogenesis in the pilocarpine model of epilepsy

Affiliations

Transcriptional upregulation of Cav3.2 mediates epileptogenesis in the pilocarpine model of epilepsy

Albert J Becker et al. J Neurosci. .

Abstract

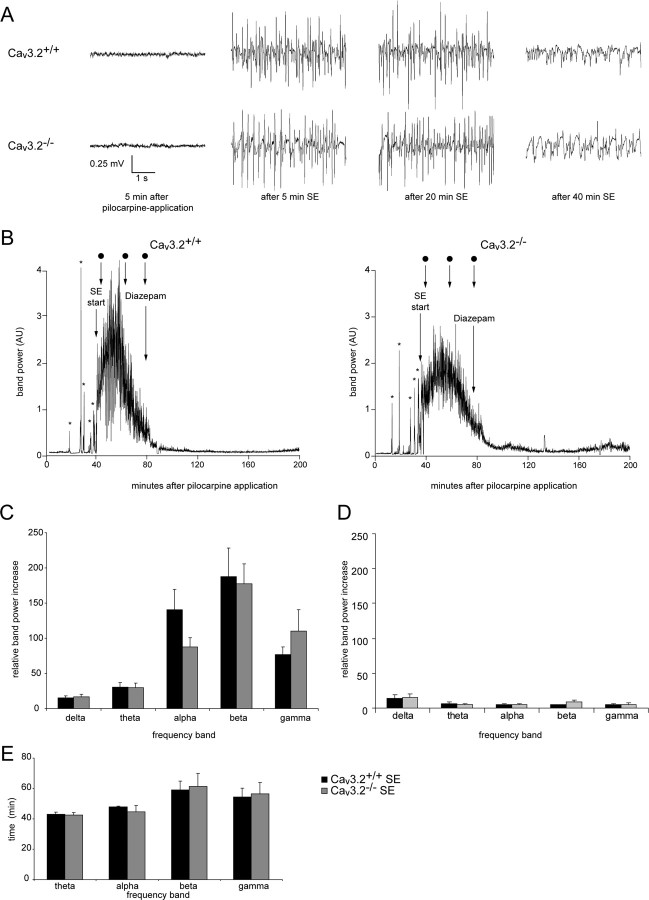
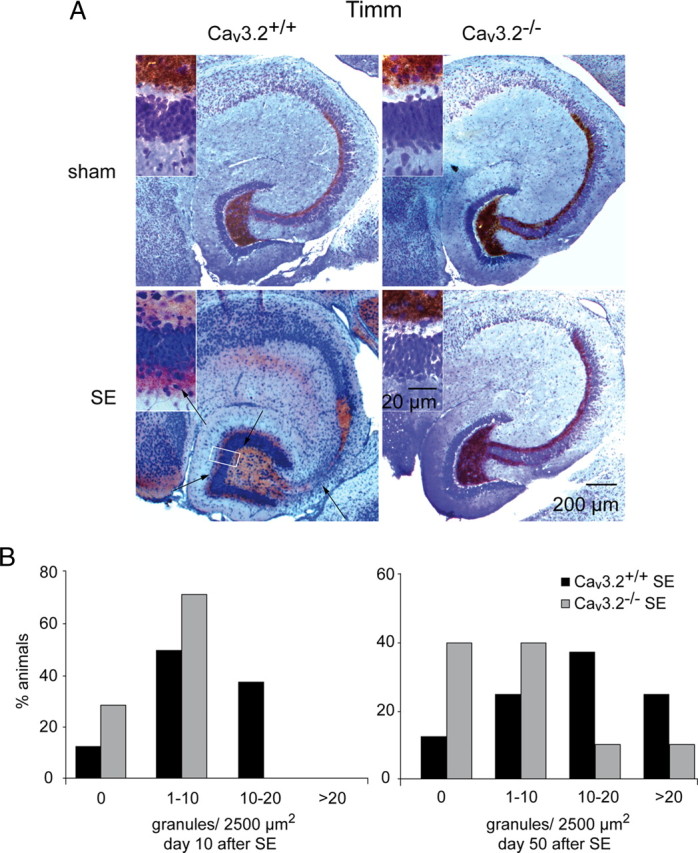
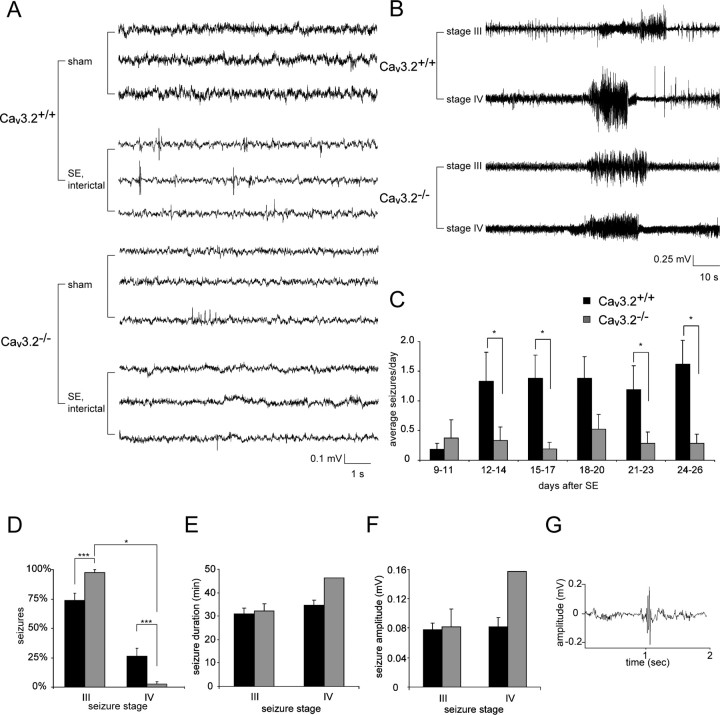
In both humans and animals, an insult to the brain can lead, after a variable latent period, to the appearance of spontaneous epileptic seizures that persist for life. The underlying processes, collectively referred to as epileptogenesis, include multiple structural and functional neuronal alterations. We have identified the T-type Ca(2+) channel Ca(v)3.2 as a central player in epileptogenesis. We show that a transient and selective upregulation of Ca(v)3.2 subunits on the mRNA and protein levels after status epilepticus causes an increase in cellular T-type Ca(2+) currents and a transitional increase in intrinsic burst firing. These functional changes are absent in mice lacking Ca(v)3.2 subunits. Intriguingly, the development of neuropathological hallmarks of chronic epilepsy, such as subfield-specific neuron loss in the hippocampal formation and mossy fiber sprouting, was virtually completely absent in Ca(v)3.2(-/-) mice. In addition, the appearance of spontaneous seizures was dramatically reduced in these mice. Together, these data establish transcriptional induction of Ca(v)3.2 as a critical step in epileptogenesis and neuronal vulnerability.


Figures

Figure 1.
Figure 1.
R/T-type Ca2+ channel subunit expression after pilocarpine-induced SE. A–E, Quantitative determination of Ca2+ channel subunit mRNAs was performed using a real-time RT-PCR approach. Error bars indicate SEM. A–D, mRNA expression of Cav3.1 (A), Cav3.2 (B), Cav3.3 (C), and Cav2.3 (D) in mice at different time points after pilocarpine-induced SE. Data are given relative to the average values in sham-control animals. A significant increase in Cav3.2 mRNA levels was observed on days 2 and 3 after SE (*p < 0.05, Mann–Whitney U test). E, An upregulation of Cav3.2 mRNA was also observed after SE in the rat (*p < 0.05, Mann–Whitney U test). F, Immunohistochemical analysis of Cav3.2 expression in the CA1 region of sham-control rats 5 d after treatment and SE-experienced rats 5 and 30 d after treatment. Antibodies were directed against Cav3.2 (red) and MAP2 (green) to visualize dendrites in the stratum radiatum. Note the strongly increased staining of Cav3.2 in MAP2-positive dendrites at 5 d after SE. OL, Overlay. Scale bar, 100 μm. G, Western blots from lysates of HEK cell lines expressing Cav3.1, Cav3.2, and Cav3.3 with an antibody directed against Cav3.2 reveal selective staining of Cav3.2 subunits. H, Western blots from hippocampal CA1 protein isolates from rats at day 5 after SE versus sham-controls (n = 5 each) with an antibody directed against Cav3.2 reveals significant induction of the Cav3.2 protein at 5 d after SE. Syph, Synaptophysin.
Figure 2.
Figure 2.
Cav3.2 upregulation underlies increased T-type Ca2+ currents in CA1 neurons after SE. A, Representative examples of T-type Ca2+ currents elicited in the presence of the organic Ca2+ channel blockers ω-conotoxin GVIA (2 μm), ω-conotoxin MVIIC (3 μm), ω-agatoxin IVA (200 nm), and nifedipine (10 μm). Voltage steps to potentials of −43 mV caused activation of a transient, inactivating Ca2+ current mainly reflecting T-type Ca2+ currents. B, To allow discrimination of T-type from R-type Ca2+ currents, tail currents were measured after brief depolarizing steps (20 ms). Slowly deactivating tail currents reflect almost exclusively activation of T-type Ca2+ currents. C, D, Quantification of the magnitude of T-type Ca2+ currents at test pulse potentials of −43 and −33 mV reveals a 2.2-fold and 1.8-fold increase, respectively. T-type Ca2+ currents were significantly augmented after SE in Cav3.2+/+ mice but not in Cav3.2−/− mice. Error bars indicate SEM, p < 0.05.
Figure 3.
Figure 3.
Cav3.2 upregulation underlies aberrant bursting after SE. A, Firing behavior of representative CA1 pyramidal cells (PCs) in a sham-control Cav3.2+/+ mouse (a1–a3) and a SE-experienced Cav3.2+/+ mouse (b1–b3), from a group recorded 7–15 d after treatment (cell in a, 12 d after sham treatment; cell in b, 9 d after SE). The bottommost traces in each panel correspond to the current injection step, and the topmost traces correspond to voltage recordings. In Aa2,a3,b2,b3 and Ca2,a3,b2,b3, the current injection step was just suprathreshold for generating an action potential. In a1 and b1, the current injection step was increased to elicit repetitive firing. B, Equivalent analysis as in A, but with Cav3.2−/− mice. C, Firing behavior of representative CA1 PCs from a group recorded 20–53 d after treatment in sham-control and SE-experienced Cav3.2+/+ mice in a (cell recorded 49 d after sham treatment) and b (cell recorded 22 d after SE), respectively. D, Quantification of the fraction of burst-firing neurons in the different experimental groups 7–15 d after treatment. Upregulation of burst firing after SE in Cav3.2+/+ mice was strongly attenuated in Cav3.2−/− mice. E, Quantification of the fraction of burst-firing neurons in the group measured 20–53 d after treatment. F, Sensitivity of aberrant burst firing in SE-experienced wild-type mice to Ni2+. The discharge of a burst-firing neuron in control ACSF (a1,a2) and after application of 100 μm Ni2+ (b1,b2). Traces from a2 and b2 are superimposed at larger magnification in c, demonstrating that application of Ni2+ dispersed the burst and markedly reduced the spike ADP.
Figure 4.
Figure 4.
Electroencephalographic and behavioral features of pilocarpine-induced SE in Cav3.2+/+ and Cav3.2−/− mice. A, Representative EEG recordings 5 min after pilocarpine application (when no signs of seizures are observed) and 5, 20, and 40 min after the start of SE for Cav3.2+/+ and Cav3.2−/− mice. B, EEG recordings before and during pilocarpine-induced SE were subjected to Fourier transformation, and the power in different frequency bands was analyzed in Cav3.2+/+ and Cav3.2−/− mice (left and right, respectively; animals identical to those shown in A). Representative analyses of band power in the gamma band are shown. The zero time point corresponds to the time of pilocarpine injection. Asterisks mark isolated behavioral seizures (at least stage III; see Materials and Methods) before animals enter continuous SE (see Materials and Methods). Dots mark the time points of the EEG recordings shown in A. Diazepam was administered to terminate SE, as indicated. AU, Arbitrary units. C, As a measure for the severity of SE, the area under the different band power curves was determined from the initiation of continuous electrographic seizure activity until the time point of diazepam injection. The resultant values were normalized to the area under the band power curve obtained from baseline EEG recordings of identical duration obtained 24 h before SE. No significant differences with respect to the increase in all frequency bands during SE, compared with the basal EEG, were observed between Cav3.2+/+ and Cav3.2−/− mice. D, Electrographic changes during the first 24 h after diazepam injection were not significantly different between Cav3.2+/+ and Cav3.2−/− mice. Band power was computed as in C. E, The duration of increased activity in the different frequency bands was quantified as the period during which band power exceeded 10% of maximum band power. No differences in duration were observed for any frequency band. Analysis in the δ-band was not performed because a clear band power peak could not be delineated. Error bars indicate SEM.
Figure 5.
Figure 5.
The development of hippocampal damage after SE is dramatically attenuated in Cav3.2−/− mice. A, Representative hippocampal sections from sham-control and SE-experienced Cav3.2+/+ and Cav3.2−/− mice stained with an antibody directed against the neuron-specific epitope NeuN. No significant neuronal cell loss is observed in these representative animals on day 2 after treatment (sham treatment or SE; n = 5 animals for each group). B, Representative hippocampal sections stained with an antibody directed against NeuN obtained 50 d after treatment. Note the pronounced neuronal cell loss in areas CA1 and CA3 after SE in Cav3.2+/+ mice but not in Cav3.2−/− mice. The higher-magnification micrographs of representative CA1 subfields of SE-experienced animals highlights the substantial neuronal degeneration in Cav3.2+/+ but not Cav3.2−/− mice (bottom). C–E, Quantification of neuronal cell density in CA1 (C), CA3 (D), and the dentate gyrus (E) in sham-control (open bars) or SE-experienced mice (filled bars). Quantification was done from H&E-stained sections. Note the pronounced neuronal cell loss in the SE group in Cav3.2+/+ but not in Cav3.2−/− mice (*p < 0.05; ***p < 0.001; t test). Day 2 after SE: Cav3.2+/+ sham, n = 5; Cav3.2+/+ SE, n = 5; Cav3.2−/− sham, n = 6; Cav3.2−/− SE, n = 5; day 10 after SE: Cav3.2+/+ sham, n = 6; Cav3.2+/+ SE, n = 8; Cav3.2−/− sham, n = 5; Cav3.2−/− SE, n = 7; day 50 after SE: Cav3.2+/+ sham, n = 6; Cav3.2+/+ SE, n = 7; Cav3.2−/− sham, n = 5; Cav3.2−/− SE, n = 9. F, We did not observe significant neuronal cell loss in either Cav3.2+/+ or Cav3.2−/− mice in the temporal neocortex, the entorhinal cortex. and the ventral subiculum in the chronic epileptic stage (n = 5 animals in each group). Error bars indicate SEM.
Figure 6.
Figure 6.
TUNEL and Fluoro-Jade staining at an early time point after SE. A, Representative TUNEL-stained hippocampal sections from sham-control and SE-experienced Cav3.2+/+ and Cav3.2−/− mice at day 2 after SE. Note TUNEL staining in the CA1 region of both Cav3.2−/− and Cav3.2+/+ mice. B, Magnified views of the CA1 pyramidal cell layer and dentate gyrus granule cell layer showing TUNEL-positive neurons in CA1, but not the dentate gyrus. C, Magnified views of the CA1 pyramidal cell layer and dentate gyrus granule cell layer showing Fluoro-Jade-positive neurons in CA1, but not the dentate gyrus. DG, dentate gyrus granule cell layer.
Figure 7.
Figure 7.
Mossy fiber sprouting after SE is substantially attenuated in Cav3.2−/− mice. A, Mossy fiber sprouting is visualized by Timm staining. SE-experienced Cav3.2+/+ mice display mossy fiber sprouting with an increased density of Timm-stained terminals in the supragranular layer, whereas sham-control mice did not (left; higher magnification in insets). In contrast, SE-induced mossy fiber sprouting is virtually absent in SE-experienced Cav3.2−/− mice (right; higher magnification in insets; scale bar in right bottom inset is for all insets). B, Assessment of the severity of mossy fiber sprouting with a semiquantitative measure (see Materials and Methods) (Mello et al., 1993) in animals 10 d after SE (left) and 50 d after SE (right). Mossy fiber sprouting is strongly reduced in Cav3.2−/− mice (χ2 test, p < 0.05). Day 10 after SE: Cav3.2+/+ sham, n = 6; Cav3.2+/+ SE, n = 8; Cav3.2−/− sham, n = 5; Cav3.2−/− SE, n = 7; day 50 after SE: Cav3.2+/+ sham, n = 6; Cav3.2+/+ SE, n = 7; Cav3.2−/− sham, n = 5; Cav3.2−/− SE, n = 9.
Figure 8.
Figure 8.
The appearance of spontaneous seizures is markedly attenuated in Cav3.2−/− mice. A, Representative interictal EEG recordings from sham-control and SE-experienced Cav3.2+/+ and Cav3.2−/− mice as indicated. Recordings were >11 d after treatment. B, Representative EEG recordings during stage III (top traces) and stage IV seizures (bottom traces) in Cav3.2−/− and Cav3.2+/+ mice. C, Development of spontaneous seizure activity after SE in Cav3.2+/+ versus Cav3.2−/− mice. Seizures were quantified in intervals of 3 consecutive days, and the average seizure frequency per day is presented as “average seizures per day.” The frequency of spontaneous seizures is substantially decreased in Cav3.2−/− versus Cav3.2+/+ mice (*p < 0.05, Mann–Whitney U test). D–F, Analysis of seizure severity in the chronic epileptic stage. D, Seizures were more severe in SE-experienced Cav3.2+/+ mice, with a high fraction of generalized stage IV seizures. In contrast, only a single Cav3.2−/− mouse had two stage IV seizures (*p < 0.05; ***p < 0.001; χ2 test). E, F, No significant differences with respect to seizure duration (E) and seizure amplitude (F) were found between Cav3.2+/+ and Cav3.2−/− mice. G, Representative example of an interictal EEG spike. These were more common in SE-experienced Cav3.2+/+ mice (see also A) compared with Cav3.2−/− mice. In D–G, n = 8 for Cav3.2−/− and n = 7 for Cav3.2+/+. Error bars indicate SEM.

Comment in

References

    1. Aptel H, Hilaire C, Pieraut S, Boukhaddaoui H, Mallie S, Valmier J, Scamps F. The Cav3.2/alpha1H T-type Ca2+ current is a molecular determinant of excitatory effects of GABA in adult sensory neurons. Mol Cell Neurosci. 2007;36:293–303. - PubMed
    1. Arikkath J, Campbell KP. Auxiliary subunits: essential components of the voltage-gated calcium channel complex. Curr Opin Neurobiol. 2003;13:298–307. - PubMed
    1. Azouz R, Jensen MS, Yaari Y. Ionic basis of spike after-depolarization and burst generation in adult rat hippocampal CA1 pyramidal cells. J Physiol. 1996;492:211–223. - PMC - PubMed
    1. Beck H, Yaari Y. Plasticity of intrinsic neuronal properties in CNS disorders. Nat Rev Neurosci. 2008;9:357–369. - PubMed
    1. Blümcke I, Beck H, Lie AA, Wiestler OD. Molecular neuropathology of human mesial temporal lobe epilepsy. Epilepsy Res. 1999;36:205–223. - PubMed

Publication types

MeSH terms