. 2008 Dec 9;105(49):19384-9.
doi: 10.1073/pnas.0810584105. Epub 2008 Dec 3.

mTORC1-dependent and -independent regulation of stem cell renewal, differentiation, and mobilization

Affiliations

mTORC1-dependent and -independent regulation of stem cell renewal, differentiation, and mobilization

Boyi Gan et al. Proc Natl Acad Sci U S A. .

Abstract

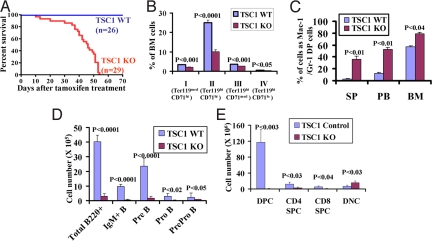
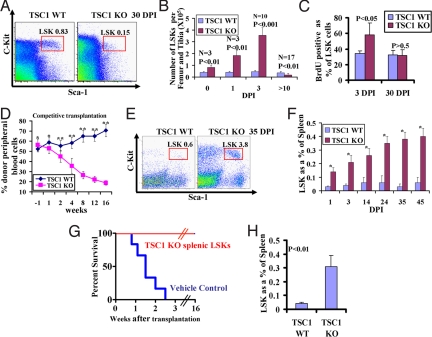
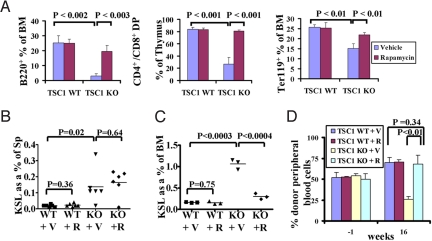
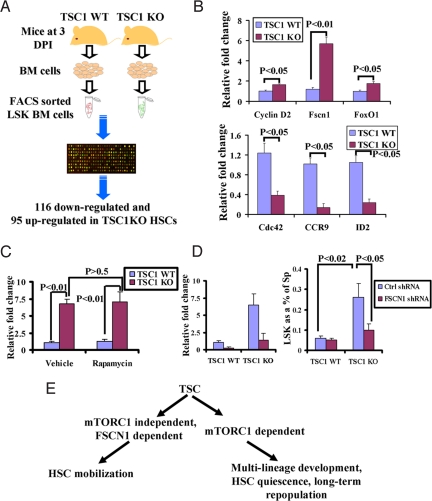
The Tuberous Sclerosis Complex component, TSC1, functions as a tumor suppressor via its regulation of diverse cellular processes, particularly cell growth. TSC1 exists in a complex with TSC2 and functions primarily as a key negative regulator of mammalian target of rapamycin complex 1 (mTORC1) signaling and protein synthesis, although the TSC1/TSC2 complex also shows mTORC1-independent outputs to other pathways. Here, we explored the role of TSC1 in various aspects of stem cell biology and dissected the extent to which TSC1 functions are executed via mTORC1-dependent versus mTORC1-independent pathways. Using hematopoietic stem cells (HSCs) as a model system, we demonstrate that somatic deletion of TSC1 produces striking stem cell and derivative effector cell phenotypes characterized by increased HSC cell cycling, mobilization, marked progressive depletion, defective long-term repopulating potential, and hematopoietic lineage developmental aberrations. On the mechanistic level, we further establish that TSC1 regulation of HSC quiescence and long-term repopulating potential and hematopoietic lineage development is mediated through mTORC1 signaling. In contrast, TSC1 regulation of HSC mobilization is effected in an mTORC1-independent manner, and gene profiling and functional analyses reveals the actin-bundling protein FSCN1 as a key TSC1/TSC2 target in the regulation of HSC mobilization. Thus, TSC1 is a critical regulator of HSC self-renewal, mobilization, and multilineage development and executes these actions via both mTORC1-dependent and -independent pathways.


Conflict of interest statement

The authors declare no conflict of interest.

Figures

Fig. 1.
Fig. 1.
Somatic deletion of TSC1 leads to fatal bone marrow failure and multiple lineage defects. (A) Kaplan–Meier overall survival analysis of Rosa26-CreERT2+, TSC1L/L (TSC1 KO) and Rosa26-CreERT2-, TSC1L/L or Rosa26-CreERT2+, TSC1+/+ (TSC1 WT) after tamoxifen treatment. (B) Bar graph showing decreased percentages of erythroid cells at different developmental stages, including proerythroblasts (population I, Ter119medCD71hi), basophilic erythroblasts (population II, Ter119hiCD71hi), late erythroblasts (populations III-IV, Ter119hiCD71med and Ter119hiCD71lo), in TSC1 KO bone marrow cells. (C) Bar graph showing increased percentages of Mac-1/Gr-1 double positive (DP) cells from spleen (SP), peripheral blood (PB), and bone marrow (BM) in TSC1 KO mice. (D) Bar graph showing decreased number of various B cell lineages in TSC1 KO bone marrow cells. (E) Bar graph showing absolute number of various subpopulations of thymic T cells, including CD4/CD8 double-positive cells (DPC), CD4 single-positive cells (CD4 SPC), CD8 single-positive cells (CD8 SPC), and CD4/CD8 double-negative cells (DNC). n > 3 for each genotyping. P values are shown in the bar graphs (B–E).
Fig. 2.
Fig. 2.
TSC1 regulates HSC quiescence and mobilization. (A) Flow cytometry analysis of LSK cell from bone marrow at 30 DPI from representative TSC1 KO and WT mice. The averaged percentage of LSK population from the Lin population is also indicated. (B) Bar graph showing the absolute numbers of LSK cells per femur and tibia at various DPIs in TSC1 KO and WT mice. P value and the number of mice of each genotype at each time point are indicated. (C) Bar graph showing the percentage of BrdU-positive LSK cells in bone marrow in TSC1 KO and WT mice at 3 and 30 DPI. n = 3 for each genotype. P value for each day is indicated. (D) Recipient mice from competitive transplantation were analyzed by CD45 staining to examine the contribution of donor-derived cells in peripheral blood at various time points before or after tamoxifen treatment. Fifteen recipients for each genotype were used in competitive transplantation. *, P > 0.1; **, P < 0.01. (E) Flow cytometry analysis of LSK cell from spleen at 35 DPI from representative TSC1 KO and WT mice. The averaged percentage of LSK population from Lin population is also indicated. (F) Bar graph showing the percentage of LSK cells from spleen in TSC1 KO and WT mice at various DPIs as indicated. n > 3 for each genotype at each time point. *, P < 0.01. (G) Kaplan–Meier overall survival analysis of lethally irradiated hosts transplanted with TSC1 KO splenic LSKs or vehicle control. n = 6 for each genotyping. (H) Bar graph showing the percentage of LSK cells from spleen in TSC1 KO and WT transplants [tamoxifen-treated WT recipient mice reconstituted with Rosa26-CreERT2+, TSC1L/L (TSC1 KO) and Rosa26-CreERT2, TSC1L/L (TSC1 WT) BM cells]. n = 6 for each genotyping.
Fig. 3.
Fig. 3.
Rapamycin treatment reveals both mTORC1-dependent and -independent TSC1-deficient phenotypes in HSC. (A) Bar graph showing the percentage of B220+ B cells, Ter119+ erythroid cells in bone marrow and CD4+/CD8+ T cells in thymus from the mice shown in Fig. S6A. n = 3 for each genotype. (B and C) Scatter plots showing the percentage of LSK cells from spleen (B) and bone marrow (C) of the mice at 4 DPI as shown in Fig. S6F. (D) Bar graph showing the percentage of donor-derived cells in peripheral blood from 1 week before and 16 weeks after tamoxifen treatment. n = 3 for each genotyping. See SI Text for a detailed description of rapamycin treatment of TSC1 KO transplants.
Fig. 4.
Fig. 4.
FSCN1 plays a key role in mediating TSC1 regulation of HSC mobilization. (A) Schematic representation of transcriptome analysis. See SI Text for a detailed description. (B) Bar graph showing relative expression fold change of selected genes between TSC1 WT and KO LSKs. n = 3 for each genotyping. (C) Bar graph showing relative expression fold change of FSCN1 between TSC1 WT and KO LSKs treated with rapamycin or vehicle. n = 3 for each genotyping. (D) Bar graph showing relative expression fold change of FSCN1 in spleen LSKs (Left) and percentage of LSK cells (Right) from spleen in TSC1 WT and KO transplants infected with control shRNA or FSCN1 shRNA-expressing lentivirus. (E) The working model showing that TSC1 regulation of HSC quiescence, long-term repopulating potential and lineage development is mediated through mTORC1 signaling, whereas TSC1 regulates HSC mobilization in an mTORC1-independent, but FSCN1-dependent manner.

References

    1. Kwiatkowski DJ, Manning BD. Tuberous sclerosis: A GAP at the crossroads of multiple signaling pathways. Hum Mol Genet. 2005;14:R251–R258. - PubMed
    1. Huang J, Manning BD. The TSC1–TSC2 complex: A molecular switchboard controlling cell growth. Biochem J. 2008;412:179–190. - PMC - PubMed
    1. Conlon I, Raff M. Size control in animal development. Cell. 1999;96:235–244. - PubMed
    1. Wullschleger S, Loewith R, Hall MN. TOR signaling in growth and metabolism. Cell. 2006;124:471–484. - PubMed
    1. Lamb RF, et al. The TSC1 tumor suppressor hamartin regulates cell adhesion through ERM proteins and the GTPase Rho. Nat Cell Biol. 2000;2:281–287. - PubMed

Publication types

MeSH terms