. 2009 Feb;296(2):R383-93.
doi: 10.1152/ajpregu.90795.2008. Epub 2008 Dec 3.

Adaptive mechanisms regulate preferred utilization of ketones in the heart and brain of a hibernating mammal during arousal from torpor

Affiliations

Adaptive mechanisms regulate preferred utilization of ketones in the heart and brain of a hibernating mammal during arousal from torpor

Matthew T Andrews et al. Am J Physiol Regul Integr Comp Physiol. 2009 Feb.

Abstract

Hibernating mammals use reduced metabolism, hypothermia, and stored fat to survive up to 5 or 6 mo without feeding. We found serum levels of the fat-derived ketone, D-beta-hydroxybutyrate (BHB), are highest during deep torpor and exist in a reciprocal relationship with glucose throughout the hibernation season in the thirteen-lined ground squirrel (Spermophilus tridecemlineatus). Ketone transporter monocarboxylic acid transporter 1 (MCT1) is upregulated at the blood-brain barrier, as animals enter hibernation. Uptake and metabolism of 13C-labeled BHB and glucose were measured by high-resolution NMR in both brain and heart at several different body temperatures ranging from 7 to 38 degrees C. We show that BHB and glucose enter the heart and brain under conditions of depressed body temperature and heart rate but that their utilization as a fuel is highly selective. During arousal from torpor, glucose enters the brain over a wide range of body temperatures, but metabolism is minimal, as only low levels of labeled metabolites are detected. This is in contrast to BHB, which not only enters the brain but is also metabolized via the tricarboxylic acid (TCA) cycle. A similar situation is seen in the heart as both glucose and BHB are transported into the organ, but only 13C from BHB enters the TCA cycle. This finding suggests that fuel selection is controlled at the level of individual metabolic pathways and that seasonally induced adaptive mechanisms give rise to the strategic utilization of BHB during hibernation.


Figures
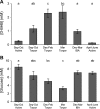
Fig. 1.
Fig. 1.
Mean serum concentrations of d-β-hydroxybutyrate (d-BHB) and glucose throughout the hibernation season. Measurements of both d-BHB (A) and glucose (B) in serum prepared from the same animals at the month(s) of year and activity state shown under the x-axis. Number of animals (n) and body temperature (Tb) at time of blood collection include September–October active (Tb = 21–38°C, n = 21); September–October torpor (Tb = 12–15°C, n = 8); December through February torpor (Tb = 5–9°C, n = 20); March torpor (Tb = 4–7°C, n = 7); December through March interbout arousal (Tb = 22–38°C, n = 13); and April through June active (Tb = 33–38°C, n = 10). Bars indicate mean serum d-BHB and glucose concentration. One-way ANOVA shows that time of year/activity state influenced the serum concentration of both d-BHB (F5,69 = 17.62, P < 0.001) and glucose (F5,69 = 7.15, P < 0.001). Error bars represent the standard error of the mean. In both A and B, bars that are not connected by the same letter (a, b, c) are significantly different according to Tukey's HSD test with Q = 2.93 and P < 0.05.
Fig. 2.
Fig. 2.
Immunohistochemistry of monocarboxylic acid transporter 1 (MCT1) and glucose transporter 1 (GLUT1) in rat and thirteen-lined ground squirrel (GS) brains. Dark staining shows site of immunolocalization. Major difference in transporter levels between the hibernating and nonhibernating species is the extraordinary amount of MCT1 in the blood vessels of the hibernator. MCT1-GS, MCT1 in cerebral cortex of torpid ground squirrel. MCT1-Rat, MCT1 in rat cerebral cortex. GLUT1-GS, GLUT1 in cerebral cortex of torpid ground squirrel. GLUT1-Rat, GLUT1 in rat cerebral cortex.
Fig. 3.
Fig. 3.
Seasonal and/or animal activity-dependent expression of MCT1 in the brain of thirteen-lined ground squirrels. A: immunohistochemistry of MCT1 in thirteen-lined ground squirrel (GS) brains during the hibernation season, where dark staining shows site of immunolocalization. The scale bar applies to all panels and equals 100 μm. AUG, active animal in August; OCT, active animal in October; DEC, torpid animal in December; APR, active animal in April; cb, cell bodies; np, neuropil; v, vessels. B: graph of MCT1 optical density at the same months and activity states shown in panel A. Bars indicate mean MCT1 levels (n = 4 for each month). Error bars represent the standard error of the mean. MCT1 level differs significantly in vessels across all four time points (ANOVA: F3,12 = 49.54, P < 0.001). Bars not connected by the same letter (a or b) are significantly different according to Tukey's HSD test with Q = 2.71 and P < 0.05. Tukey's HSD post hoc analysis shows that the level of MCT1 was significantly higher in vessels of December-torpid (DEC-Torpid) animals than in vessels from the other three active groups.
Fig. 4.
Fig. 4.
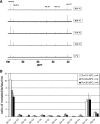
13C-labeling of brain metabolites following injection of torpid (Tb = 5–7°C) ground squirrels with 13C-BHB. A: spectra of 13C-labeled metabolites in the 20 to 60 ppm region assayed on a 14.1 Tesla UNITY INOVA spectrophotometer (Varian, Palo Alto, CA). Body temperature at the time of death is indicated next to the respective spectra. Abbreviations for metabolites and the specific carbon labeled: BHB C2, β-hydroxybutyrate C2; Glu C4, glutamate C4; BHB C4, β-hydroxybutyrate C4. B: graph showing the relative levels of labeled metabolites normalized to natural abundance 13C-myo-inositol which is not labeled by injection of 13C-BHB. Metabolites shown on the x-axis are listed left to right in the order they are found on spectra from highest to lowest parts per million, respectively. Labeled BHB C2 and C4 have been combined as a single BHB value. Body temperature (Tb) range of animals at the time of death and number of animals (n) are defined in the upper right corner of the graph. Error bars show standard error of the mean. Asp, aspartate; BHB, β-hydroxybutyrate; Cr, creatine; GABA, gamma-aminobutyric acid; Gln, glutamine; Glu, glutamate; Lac, lactic acid.
Fig. 5.
Fig. 5.
13C-labeling of brain metabolites following injection of torpid (Tb = 5–7°C) ground squirrels with 13C-glucose. A: Spectra of 13C-labeled metabolites assayed on a 14.1-Tesla UNITY INOVA spectrophotometer (Varian, Palo Alto, CA). Body temperature at the time of death is indicated next to the respective spectra. myoIns, myo-inositol; Lac C3, lactate C3; Glc C1α, glucose C1 alpha; Glc C1β, glucose C1 beta; Glu C4, glutamate C4. B: graph showing the relative levels of labeled metabolites normalized to natural abundance 13C-myo-inositol, which is not labeled by injection of 13C-glucose. Metabolites shown on the x-axis are listed left to right in the order they are found on spectra from highest to lowest parts per million, respectively. Labeled Glc C1α and C1β have been combined as a single Glc C1 value. Body temperature (Tb) range of animals at the time of death and number of animals (n) are defined in the upper right corner of the graph. Error bars show standard error of the mean. Ala, alanine; Glc, glucose; others are defined in Fig. 4B.
Fig. 6.
Fig. 6.
13C-labeling of heart metabolites following injection of torpid (Tb = 5–7°C) ground squirrels with 13C-BHB. A: spectra of 13C-labeled metabolites in the 20 to 60 ppm region assayed on a 14.1 Tesla UNITY INOVA spectrophotometer. Body temperature at the time of death is indicated next to the respective spectra. Abbreviations for metabolites and the specific carbon labeled: Tau C1, taurine C1; BHB C2, β-hydroxybutyrate C2; Tau C2, taurine C2; Glu C4, glutamate C4; BHB C4, β-hydroxybutyrate C4. B: graph showing the relative levels of labeled metabolites normalized to natural abundance 13C-taurine, which is not labeled by injection of 13C-BHB. Metabolites shown on the x-axis are listed left to right in the order they are found on spectra from highest to lowest parts per million, respectively. Labeled BHB C2 and C4 have been combined as a single BHB value. Body temperature (Tb) range of animals at the time of death and number of animals (n) are defined in the upper right corner of the graph. Error bars show standard error of the mean. Metabolite abbreviations are defined in the legend of Fig. 4B.
Fig. 7.
Fig. 7.
13C-labeling of ground squirrel heart metabolites following injection of torpid (Tb = 5–7°C) ground squirrels with 13C-glucose. A: spectra of 13C-labeled metabolites assayed on a 14.1-Tesla UNITY INOVA spectrophotometer. Body temperature at the time of death is indicated next to the respective spectra. Abbreviations for metabolites and the specific carbon labeled Tau C1, taurine C1; Tau C2, taurine C2; Lac C3, lactate C3; Glc C1α, glucose C1 alpha; Glc C1β, glucose C1 beta; Glu C4, glutamate C4. B: graph showing the relative levels of labeled metabolites normalized to natural abundance 13C-taurine, which is not labeled by injection of 13C-glucose. Metabolites shown on the x-axis are listed left to right in the order they are found on spectra from highest to lowest parts per million, respectively. Labeled Glc C1α and C1β have been combined as a single Glc C1 value. The Tb range of animals at the time of death and the number of animals (n) are defined in the upper right corner of the graph. Error bars show standard error of the mean. Ala, alanine; Glc, glucose; others are defined in Fig. 4B.
Fig. 8.
Fig. 8.
Level of [4-13C] glutamate (Glu C4) after injection with 13C-BHB or 13C-glucose. A: brain level of 13C-Glu C4 relative to natural abundance 13C-myo-inositol plotted as a function of Tb at time of death (BHB, n = 18; glucose, n = 17). Relative level of Glu C4 increased significantly with Tb following injection of 13C-BHB (according to the equation 0.11 + 0.24 × Tb; R2 = 0.30; F1,16 = 6.86, P < 0.05) and 13C-glucose (according to the equation 0.21 + 0.04 × Tb; R2 = 0.26; F1,15 = 5.25, P < 0.05). In the brain, the slope of the relationship between Glu C4 level and Tb was significantly greater for 13C-BHB-injected individuals than for those injected with 13C-glucose (test for equality of slope: F1,31 = 4.61, P < 0.05). B: heart level of 13C-Glu C4 relative to natural abundance 13C-taurine is plotted as a function of Tb at the time of death (BHB, n = 17; glucose, n = 16). Body temperature did not significantly influence the level of Glu C4 in the heart of arousing animals when either 13C-BHB or 13C-glucose was injected. Slopes of the best-fit regression lines for Glu C4 level and Tb are not significantly different from a slope of zero for 13C-BHB (F1,15 = 3.3, P = 0.09) and 13C-glucose (F1,14 = 3.5, P = 0.08). A and B: open circles represent Glu C4 levels of individual animals injected with 13C-BHB, and the solid line represents the best-fit linear regression through these points. Solid squares represent Glu C4 levels of individual animals injected with 13C-glucose, and the dotted line represents the best-fit linear regression through these points. In both brain and heart, the mean level of Glu C4 resulting from 13C-BHB injection was significantly higher than that from injection with 13C-glucose at all body temperatures (ANOVA: F1,33 = 35.81, P < 0.001 and F1,31 = 29.62, P < 0.001, brain and heart, respectively).
Fig. 9.
Fig. 9.
Model showing the mechanism of β-hydroxybutyrate utilization and glucose conservation in the heart and brain during hibernation. Long solid lines with arrowheads indicate active metabolic pathways, dashed lines with arrowheads indicate pathways with reduced activity, and a solid block across a line indicates pathway stoppage. Short vertical arrows pointing up indicate an increase in concentration or activity. Short vertical arrows pointing down indicate a decrease in concentration or activity. BHB, beta-hydroxybutyrate; MCT1, monocarboxylic acid transporter 1; PDK4, pyruvate dehydrogenase kinase 4; SCOT, succinyl CoA transferase; TCA cycle, tricarboxylic acid cycle.

References

    1. Andrews MT Advances in molecular biology of hibernation in mammals. Bioessays 29: 431–440, 2007. - PubMed
    1. Andrews MT, Squire TL, Bowen CM, Rollins MB. Low-temperature carbon utilization is regulated by novel gene activity in the heart of a hibernating mammal. Proc Natl Acad Sci USA 95: 8392–8397, 1998. - PMC - PubMed
    1. Buck MJ, Squire TL, Andrews MT. Coordinate expression of the PDK4 gene: a means of regulating fuel selection in a hibernating mammal. Physiol Genomics 8: 5–13, 2002. - PubMed
    1. Cruz NF, Dienel GA. High glycogen levels in brains of rats with minimal environmental stimuli: implications for metabolic contributions of working astrocytes. J Cereb Blood Flow Metab 22: 1476–1489, 2002. - PubMed
    1. Grey NJ, Karl I, Kipnis DM. Physiologic mechanisms in the development of starvation ketosis in man. Diabetes 24: 10–16, 1975. - PubMed

Publication types

MeSH terms