Review
. 2008 Dec;72(4):557-78, Table of Contents.
doi: 10.1128/MMBR.00009-08.

A bioinformatician's guide to metagenomics

Affiliations
Review

A bioinformatician's guide to metagenomics

Victor Kunin et al. Microbiol Mol Biol Rev. 2008 Dec.

Abstract

As random shotgun metagenomic projects proliferate and become the dominant source of publicly available sequence data, procedures for the best practices in their execution and analysis become increasingly important. Based on our experience at the Joint Genome Institute, we describe the chain of decisions accompanying a metagenomic project from the viewpoint of the bioinformatic analysis step by step. We guide the reader through a standard workflow for a metagenomic project beginning with presequencing considerations such as community composition and sequence data type that will greatly influence downstream analyses. We proceed with recommendations for sampling and data generation including sample and metadata collection, community profiling, construction of shotgun libraries, and sequencing strategies. We then discuss the application of generic sequence processing steps (read preprocessing, assembly, and gene prediction and annotation) to metagenomic data sets in contrast to genome projects. Different types of data analyses particular to metagenomes are then presented, including binning, dominant population analysis, and gene-centric analysis. Finally, data management issues are presented and discussed. We hope that this review will assist bioinformaticians and biologists in making better-informed decisions on their journey during a metagenomic project.


Figures
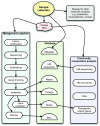
FIG. 1.
FIG. 1.
Typical workflow for Sanger-based metagenomic projects of bacterial and archaeal communities at the JGI. Oval boxes indicate processes, and half-circles indicate data. See the text for discussion.
FIG. 2.
FIG. 2.
Contig size distribution for assemblies of around 100 Mbp of Sanger data obtained from each of seven microbial communities. The gray area indicates small contigs with a higher likelihood of chimeric assemblies (see “Assembly”). Communities with contigs found mostly in this zone (termite hindgut [146], soil, and whale fall [135]) lack dominant populations, whereas communities with larger contigs outside this zone have dominant populations: gutless worm (150), phosphorus-removing sludges from U.S. and Australian (OZ) laboratory-scale bioreactors (47), and an acid mine drainage (AMD) biofilm (138). Note that the gutless worm scaffolds (end-pair-linked contigs) are shown, explaining the larger size.
FIG. 3.
FIG. 3.
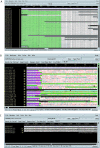
Phrap assemblies visualized with the Consed (53) program. The consensus sequence is shown at the top of the display and is derived from aligned reads shown below the consensus. Note that the Phrap assembler uses the highest-quality base for the consensus regardless of base frequency at each position. Read identifiers and orientation (arrowheads) are shown on the left of the display. Low-quality bases and masked regions are grayed out. Green bars indicate sequence fragments found elsewhere in the assembly. (A) Example of a good-quality assembly with high read depth. Note the consistent alignment of all residues. (B) Example of a misassembled contig drawn together by a common repeat sequence (indicated by purple bars at left). Note the misaligned residues in red and the meaningless “consensus” sequence that does not correspond to any single read below it. (C) Chimeric contig produced by coassembly of closely related strains (haplotypes) in a metagenomic data set. Note that the consensus sequence is a chimera of the two haplotypes (based on the highest-quality base at each position) and likely does not represent an extant organism. (Screen shots are printed with permission of the software publisher.)
FIG. 4.
FIG. 4.
Part of the chromatogram of a low-quality read without quality trimming on which multiple nonexistent genes were predicted (bottom).
FIG. 5.
FIG. 5.
Screenshot of SNP-VISTA showing SNPs in individual reads relative (and aligned) to a reference contig belonging to “Candidatus Accumulibacter phosphatis” (74) (labeled query at the bottom and highlighted in pale green). (Top) Alignment condensed to show only polymorphic columns color coded by base (see left for color coding). (Bottom) Expanded alignment. Note that reads are ordered dynamically by similarity for the window under investigation to facilitate SNP pattern recognition.
FIG. 6.
FIG. 6.
Screenshot of JCVI's Advanced Reference Viewer (http://gos.jcvi.org/openAccess/advancedReferenceviewer.html). A reference contig or genome, in this case, Prochlorococcus marinus strain AS9601, shown on the x axis, against which metagenomic reads, in this case, from the Global Ocean Survey (115), is aligned and arrayed by similarity to the reference sequence on the y axis. Reads have been color coded according to sampling site to highlight site-to-site variations in Prochlorococcus populations but can be color coded by any type of metadata or other features such as the consistency of read mate pairs. Genomic islands peculiar to strain AS9601 are easily identified as gaps in the read coverage (between 60 and 70 kb). This viewer also allows users to zoom into regions of interest for higher resolution. (Image courtesy of Doug Rusch.)
FIG. 7.
FIG. 7.
Screenshot (at left) from the IMG/M database (91) showing one implementation of gene-centric analysis available through this system. Four PFAM families involved in cellulose hydrolysis are shown in columns color coded to match the pathway schematic to the right. The relative representation of these families in 12 metagenomic data sets (rows) is shown as fractions normalized for data set size. Overrepresented families are further highlighted by color: bisque, moderately overrepresented; yellow, highly overrepresented. This figure shows that termite hindgut followed by human gut samples have the greatest overrepresentation of genes involved in cellulose hydrolysis and, indeed, are the only communities of the compared data sets that appear to have the enzymatic potential to break down cellulose. It also shows that one whale fall sample, a soil sample from the drainage path of a silage storage bunker, and one laboratory-scale phosphorus-removing sludge sample are moderately overrepresented in genes for processing the dimer cellobiose. (Image courtesy of Falk Warnecke.)

References

    1. Abe, T., S. Kanaya, M. Kinouchi, Y. Ichiba, T. Kozuki, and T. Ikemura. 2003. Informatics for unveiling hidden genome signatures. Genome Res. 13693-702. - PMC - PubMed
    1. Abe, T., H. Sugawara, M. Kinouchi, S. Kanaya, and T. Ikemura. 2005. Novel phylogenetic studies of genomic sequence fragments derived from uncultured microbe mixtures in environmental and clinical samples. DNA Res. 12281-290. - PubMed
    1. Achtman, M., and M. Wagner. 2008. Microbial diversity and the genetic nature of microbial species. Nat. Rev. Microbiol. 6431-440. - PubMed
    1. Allen, E. E., and J. F. Banfield. 2005. Community genomics in microbial ecology and evolution. Nat. Rev. Microbiol. 3489-498. - PubMed
    1. Allen, E. E., G. W. Tyson, R. J. Whitaker, J. C. Detter, P. M. Richardson, and J. F. Banfield. 2007. Genome dynamics in a natural archaeal population. Proc. Natl. Acad. Sci. USA 1041883-1888. - PMC - PubMed

Publication types