. 2009 Jan 1;457(7225):92-6.
doi: 10.1038/nature07434. Epub 2008 Dec 3.

Live-animal tracking of individual haematopoietic stem/progenitor cells in their niche

Affiliations

Live-animal tracking of individual haematopoietic stem/progenitor cells in their niche

Cristina Lo Celso et al. Nature. .

Abstract

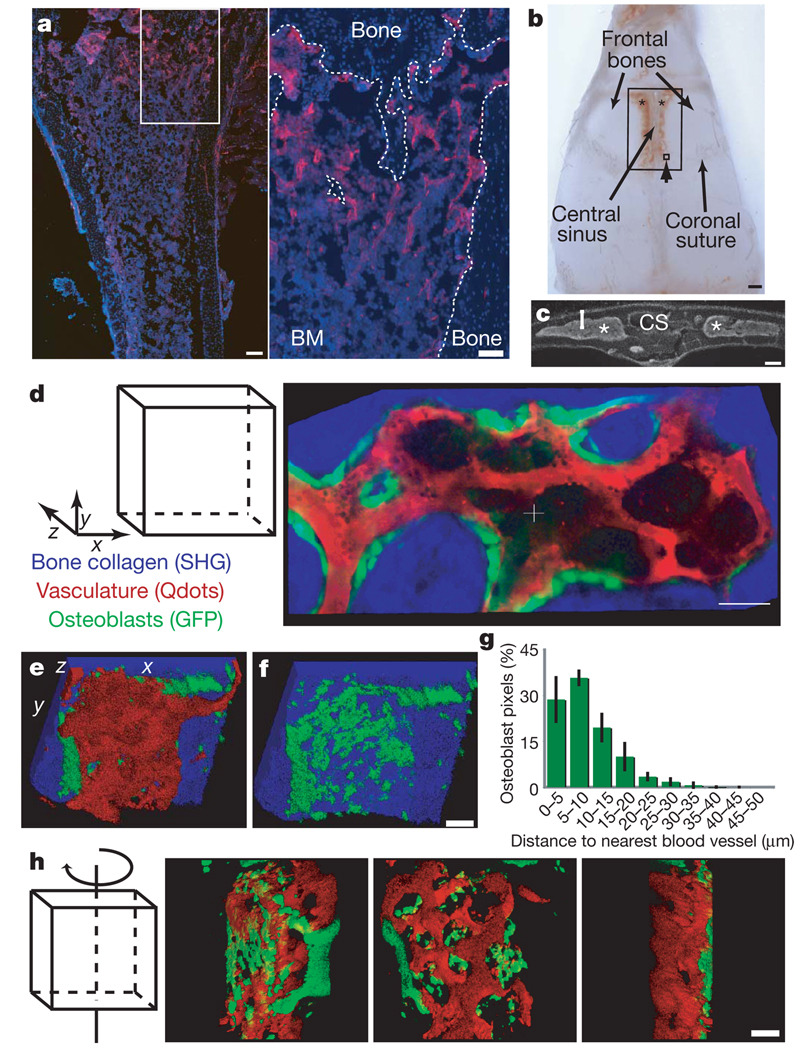
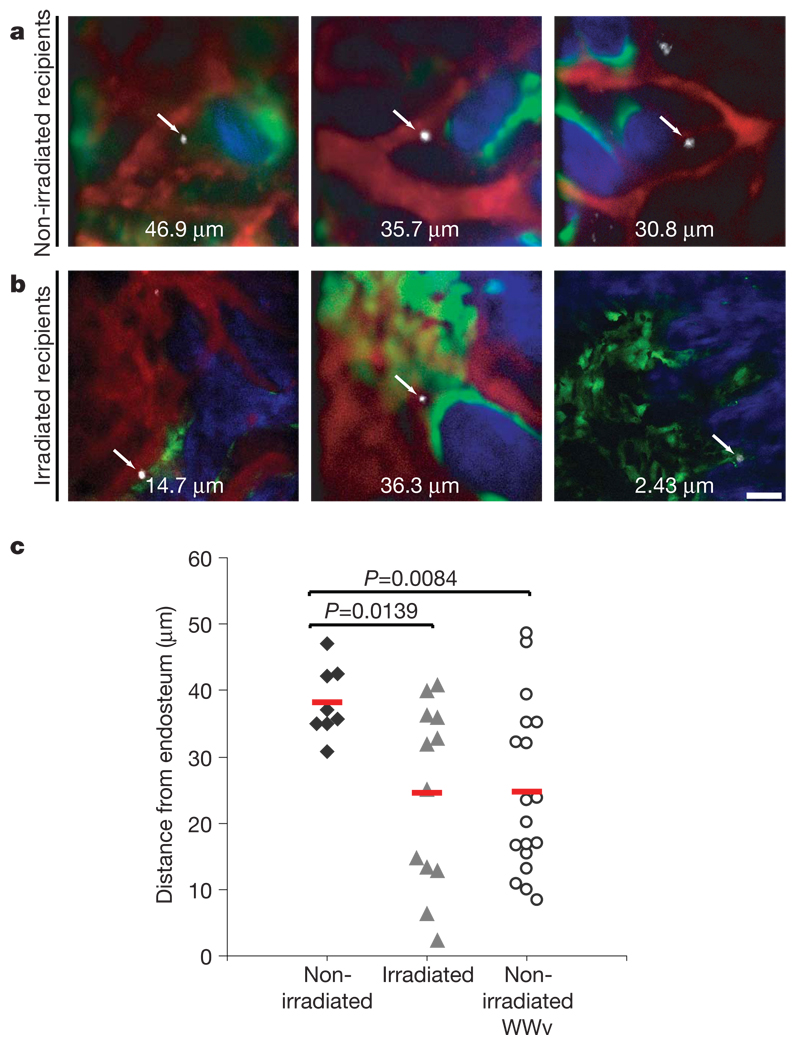
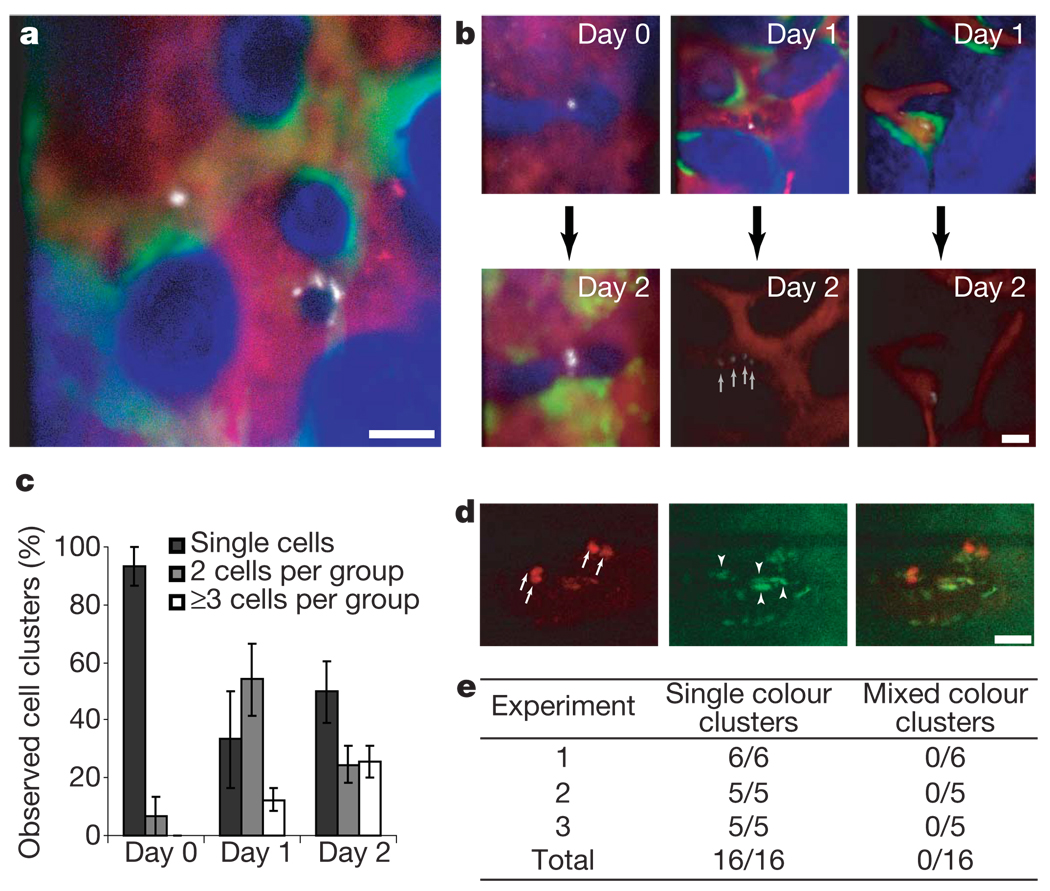
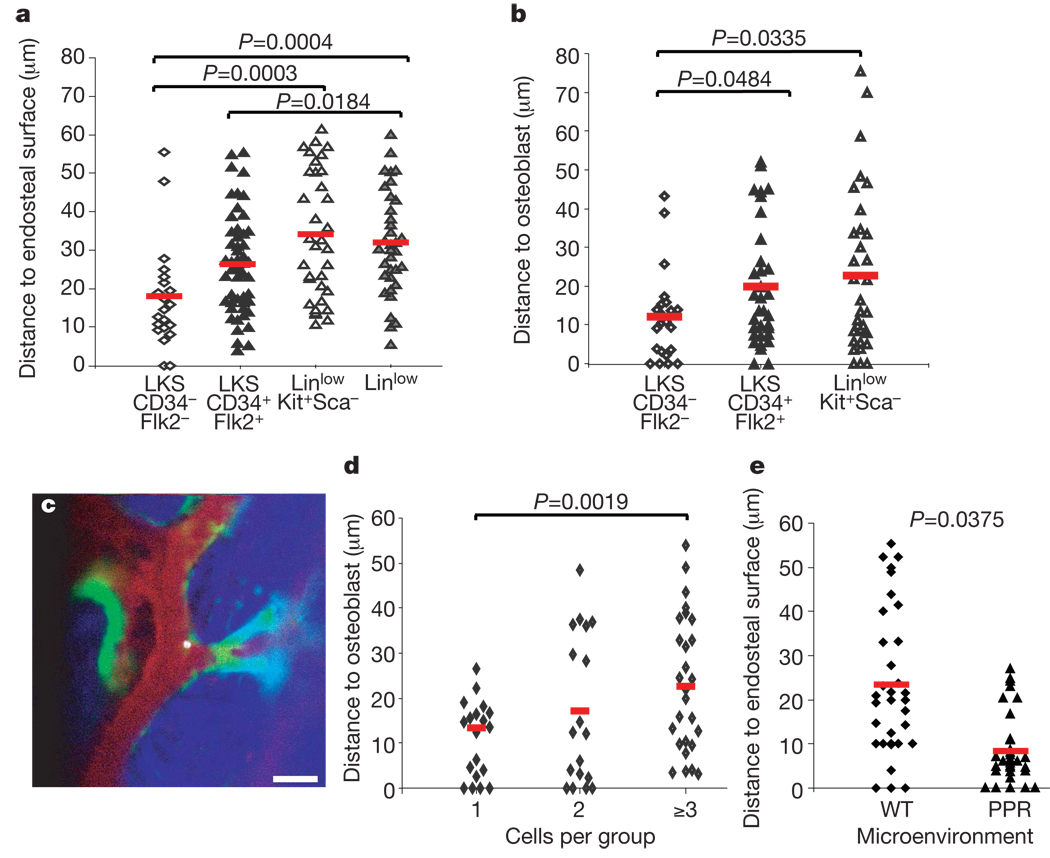
Stem cells reside in a specialized, regulatory environment termed the niche that dictates how they generate, maintain and repair tissues. We have previously documented that transplanted haematopoietic stem and progenitor cell populations localize to subdomains of bone-marrow microvessels where the chemokine CXCL12 is particularly abundant. Using a combination of high-resolution confocal microscopy and two-photon video imaging of individual haematopoietic cells in the calvarium bone marrow of living mice over time, we examine the relationship of haematopoietic stem and progenitor cells to blood vessels, osteoblasts and endosteal surface as they home and engraft in irradiated and c-Kit-receptor-deficient recipient mice. Osteoblasts were enmeshed in microvessels and relative positioning of stem/progenitor cells within this complex tissue was nonrandom and dynamic. Both cell autonomous and non-autonomous factors influenced primitive cell localization. Different haematopoietic cell subsets localized to distinct locations according to the stage of differentiation. When physiological challenges drove either engraftment or expansion, bone-marrow stem/progenitor cells assumed positions in close proximity to bone and osteoblasts. Our analysis permits observing in real time, at a single cell level, processes that previously have been studied only by their long-term outcome at the organismal level.


Figures

Figure 1
Figure 1. The calvarium endosteal niche is perivascular
a, Anti-CD31 immunofluorescence (red) reveals a complex vascular network in the trabecular region of the tibia and along diaphysis endosteal surface (blue: 4,6-diamidino-2-phenylindole (DAPI) nuclear counter-stain). The right panel shows the boxed area at higher magnification and the dashed line highlights the endosteal surface. Scale bars: left, 200 µm; right, 100 µm. BM, bone marrow. b, Intravital microscopy was used to scan the region of mouse calvarium containing bone marrow (asterisks) within the frontal bones. The large box shows the entire scanned area; the small box (arrowhead) shows one approximate observed field (330 µm2). Scale bar: 1 mm. c, DAPI-stained calvarium coronal section indicating cavity morphology (asterisks mark the bone marrow) and depth of scanning (bracket). d, xy collage image of bone (blue), osteoblasts (green) and vasculature (red) acquired simultaneously with two-photon microscopy. (See also Supplementary Movie 1.) e, f, Three-dimensional reconstructions of Z-stack with all three components (e) or bone and osteoblasts only (f). g, Diagram representing measured distance between all osteoblast pixels and the closest vasculature (n = 4 cavities; error bars indicate s.d.). h, Rotating three-dimensional model of osteoblasts and vasculature. Consistent results were seen with ten mice. Scale bars for d, f, h indicate 50 µm.
Figure 2
Figure 2. Engrafting HSPCs reach the endosteum
a, b, LKS CD48Flk2 cells injected into non-irradiated (a, n = 3 mice) or irradiated recipients (b, n = 3 mice) were imaged within 5 h of transplantation. Two-photon microscopy was used to detect collagen bone SHG (blue) and confocal microscopy was used to detect DiD signal (white), Qdot vascular dye (red) and GFP-positive osteoblasts (green) in all panels apart from bottom right, where all signals were acquired with two-photon microscopy. Arrows point to single homed HSPCs and the numbers are the xy distance measured from each cell to the closest endosteum (edge of blue signal). Scale bar: 50 µm. c, The shortest three-dimensional HSPC–endosteal surface distance was plotted for each cell imaged in non-irradiated, irradiated and WWv recipients. The average distance of HSPCs from the endosteum in irradiated and WWv recipients (n = 3 mice) was significantly less than in non-irradiated recipients. Red lines represent the mean of all measurements for each set of experiments.
Figure 3
Figure 3. Engraftment is initiated by asynchronous HSPC cell divisions
a, HSPC progeny were imaged 1 day after injection in irradiated recipients (n = 4 mice), revealing heterogeneity in cell clustering. Blue, bone; red, vasculature; green, osteoblasts; white, HSPC progeny. b, Cells were tracked from day 0 to day 2 (n = 2 recipient mice) or from day 1 to day 2 (n = 3 recipient mice) and diverse kinetics of cell division were observed. c, Increasing numbers of clusters containing 2 or ≥3 cells were observed in the days after injection (n = 4; error bars indicate s.e.m.). d, When 50% of cells were stained with DiD and 50% with DiI before injection, only single-colour clusters were observed. Red, DiD; green, autofluorescence. Arrows point at each DiD-positive cell within two clusters; arrowheads point at autofluorescent cells. Cells accepted for assessment had a dye/autofluorescence signal ratio >2 (in this example 2.82, 3.71, 4.12, 8.22). The same analysis was used to validate DiI signals. Scale bars in a, b, d are 50 µm. e, Summary of observed cell clusters in three independent experiments.
Figure 4
Figure 4. Cell-dependent and niche-dependent HSPC localization
a, b,LKS CD34Flk2 (n = 6 recipients) LT-HSC-enriched, LKS CD34+FLk2+ MPP (n = 3 recipients), LinlowKit+Sca progenitors (n = 3 recipients) and Linlow (n = 4 recipients) populations home to distinct locations, closer to or further from endosteum (a) and osteoblasts (b). All imaging was performed within 5 h of transplantation. c, Representative image of a LKS CD34Flk2 cell residing adjacent to an osteoblast and close to endosteum 4 h after injection. White, DiD-labelled cell; green, GFP+ osteoblasts; red, Qdot vascular dye; blue, bone collagen. Scale bar: 50 µm. d, Independently of the LT-HSC-enriched starting population, the distance between DiD-labelled cells and osteoblasts measured 2 days after injection increased with the number of cells found in each observed cluster (n = 5 imaged mice). e, Two days after injecting the same number of LKS cells in irradiated wild-type or PPR mice (n = 2 + 2) similar numbers of cells were observed, but LKS progeny in PPR mice were preferentially located adjacent to the endosteal surface. Red lines indicate the mean of all measurements in each set of experiments.

References

    1. Schofield R. The relationship between the spleen colony-forming cell and the haemopoietic stem cell. Blood Cells. 1978;4:7–25. - PubMed
    1. Xie T, Spradling AC. A niche maintaining germ line stem cells in the Drosophila ovary. Science. 2000;290:328–330. - PubMed
    1. Sipkins DA, et al. In vivo imaging of specialized bone marrow endothelial microdomains for tumour engraftment. Nature. 2005;435:969–973. - PMC - PubMed
    1. Calvi LM, et al. Osteoblastic cells regulate the haematopoietic stem cell niche. Nature. 2003;425:841–846. - PubMed
    1. Nilsson SK, et al. Osteopontin, a key component of the hematopoietic stem cell niche and regulator of primitive hematopoietic progenitor cells. Blood. 2005;106:1232–1239. - PubMed

Publication types

Substances