. 2008;3(12):e3866.
doi: 10.1371/journal.pone.0003866. Epub 2008 Dec 4.

Large differences in aging phenotype between strains of the short-lived annual fish Nothobranchius furzeri

Affiliations

Large differences in aging phenotype between strains of the short-lived annual fish Nothobranchius furzeri

Eva Terzibasi et al. PLoS One. 2008.

Abstract

Background: A laboratory inbred strain of the annual fish Nothobranchius furzeri shows exceptionally short life expectancy and accelerated expression of age markers. In this study, we analyze new wild-derived lines of this short-lived species.

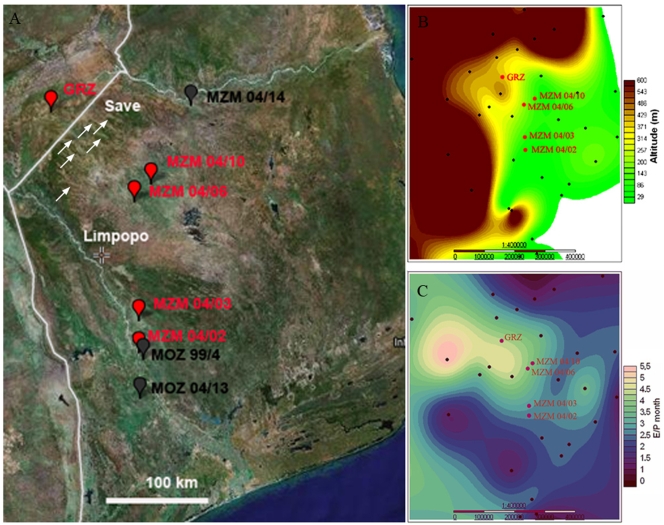
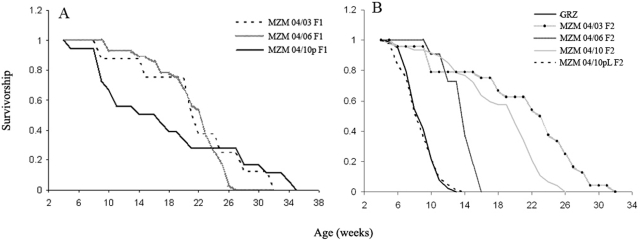
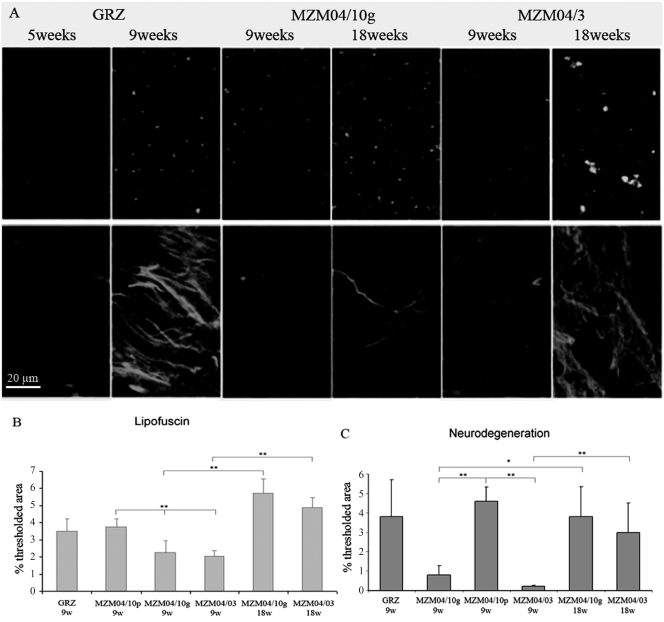
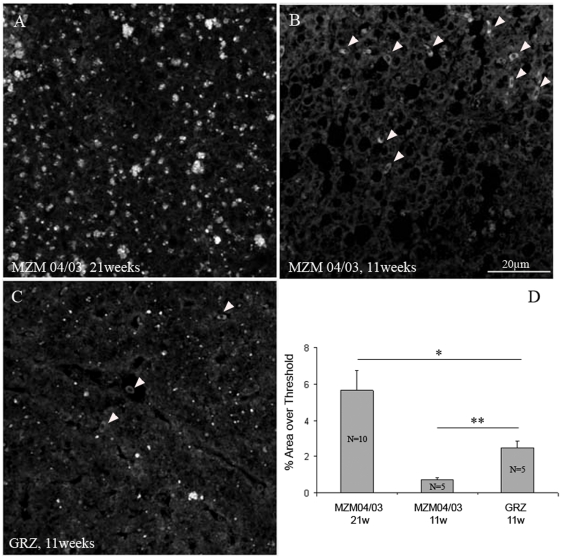
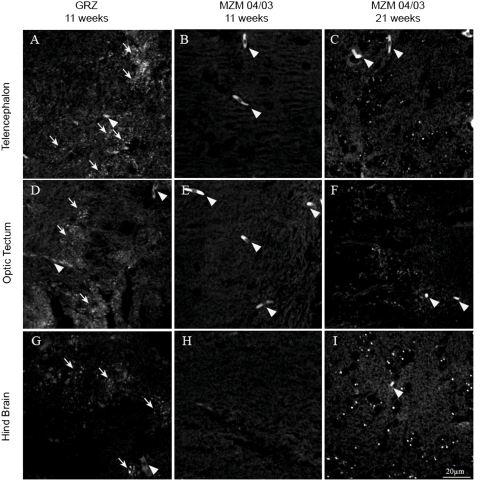
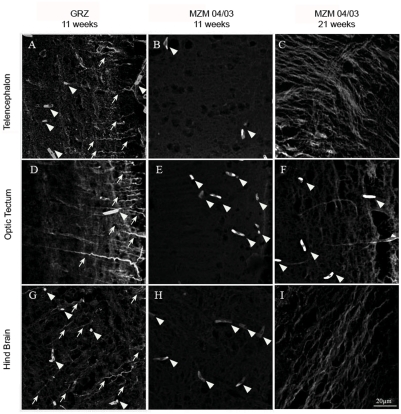
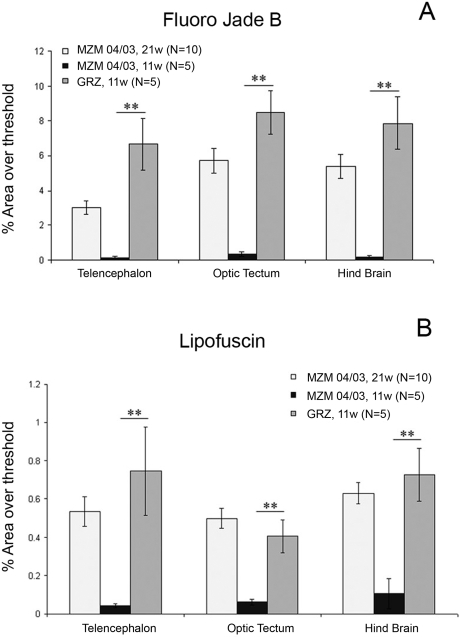
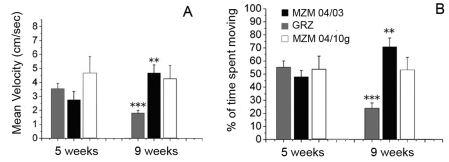
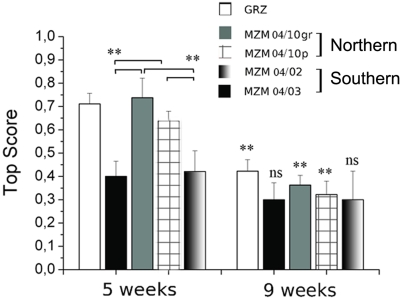
Methodology/principal findings: We characterized captive survival and age-related traits in F1 and F2 offspring of wild-caught N. furzeri. Wild-derived N. furzeri lines showed expression of lipofuscin and neurodegeneration at age 21 weeks. Median lifespan in the laboratory varied from to 20 to 23 weeks and maximum lifespan from 25 to 32 weeks. These data demonstrate that rapid age-dependent decline and short lifespan are natural characteristics of this species. The N. furzeri distribution range overlaps with gradients in altitude and aridity. Fish from more arid habitats are expected to experience a shorter survival window in the wild. We tested whether captive lines stemming from semi-arid and sub-humid habitats differ in longevity and expression of age-related traits. We detected a clear difference in age-dependent cognitive decline and a slight difference in lifespan (16% for median, 15% for maximum lifespan) between these lines. Finally, we observed shorter lifespan and accelerated expression of age-related markers in the inbred laboratory strain compared to these wild-derived lines.

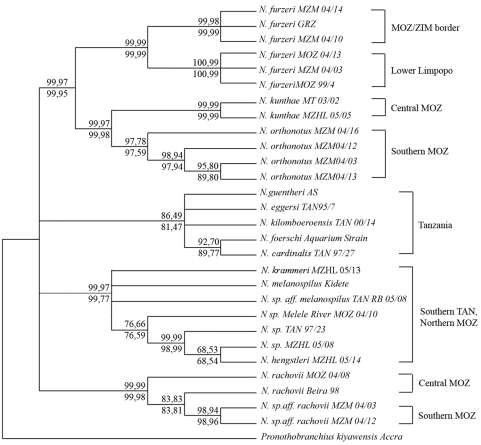
Conclusions/significance: Owing to large differences in aging phenotypes in different lines, N. furzeri could represent a model system for studying the genetic control of life-history traits in natural populations.


Conflict of interest statement

Competing Interests: The authors have declared that no competing interests exist.

Figures

Figure 1
Figure 1. Location of N. furzeri habitats.
(A) GPS of habitats mapped using GPS Visualizer onto a GoogleEarth image. Red flags represent habitats for lines for which lifespan data were recorded. Save and Limpopo indicate the two major rivers that limit the distribution area. Small arrows point to intermittent streams originating on the Gona Re Zhou plateau. Black flags represent habitats for which no lifespan data were recorded, but specimens were included in the phylogenetic analysis. (B) The same habitats localized onto a GIS elevation map. (C) The same habitats localized onto a GIS interpolation of the ratio between evaporation and 30-year annual average precipitation. Meteorological stations used for GIS interpolations are indicated in black.
Figure 2
Figure 2. Distance-based cladogram of Nothobranchius from southern Africa.
The cladogram is based on a partial sequence of the cox1 mitochondrial locus. The codes after the species names refer to specific collection points. The brackets indicate the geographic origin of the clade. ZIM, Zimbabwe; MOZ, Mozambique, TAN; Tanzania. The support values over each node are the confidence probability obtained by the Minimum Evolution algorithm. The support values under each node corresponds to the Neighbor Joining algorithm. The left values corresponds to interior-branch test and the right values to 3000 bootstratps. All trees used maximum composite likelihood (MCL) Computations were performed using MEGA 4.0 .
Figure 3
Figure 3. Survivorship of F1 and F2 generations.
(A) Survivorship of the F1 generation of wild-derived fish MZM-04/03 (n = 8), MZM-04/06 (n = 28) and MZM-04/10P (n = 18). (B) Survivorship of the F2 generation of MZM-04/03 (n = 24), MZM-04/06 (n = 11), MZM-04/10G (n = 47) and MZM-04/10P (n = 90) and of the inbred line GRZ (n = 93).
Figure 4
Figure 4. Age-dependent histological markers.
(A) Representative confocal images depicting lipofuscin staining in the liver (upper row) and Fluoro-Jade B staining in the optic tectum (lower row) in the different strains at two ages. (B,C) Quantification of lipofuscin autofluorescence and Fluoro-Jade B staining as a percentage of the threshold area. Sample size n = 3 for all strains and ages. Error bars represent standard error of the mean. Student's t-test, *P<0.05, **P<0.01.
Figure 5
Figure 5. Lipofuscin in the liver.
Confocal images taken at an excitation wavelength of 488 nm. Images are projections of seven confocal planes at a distance of 1 µm. (A) Liver section from 21-week-old MZM-04/03. (B) Liver section from 11-months old MZM-04/03; white arrowheads point to autofluorescent erythrocytes, which were excluded from the analysis. (C) Liver section from 11-week-old GRZ; white arrowheads point to erythrocytes, which were excluded from the analysis. (D) Quantification of lipofuscin density based on percentage threshold area. Student's t-test, *P<0.05, **P<0.01.
Figure 6
Figure 6. Lipofuscin in the brain.
Confocal images taken at an excitation wavelength of 488 nm. Images are projections of seven confocal planes at a distance of 1 µm. (A) Telencephalon, (B) optic tectum, and (C) hindbrain from 21-week-old MZM-04/03. (D) Telencephalon, (E) optic tectum, and (F) hindbrain from 11-week-old MZM-04/03. (G) Telencephalon, (H) optic tectum, and (I) hindbrain from 11-week-old GRZ. White arrows denote lipofuscin granules. Arrowheads point to autofluorescent erythrocytes, which were excluded from the analysis.
Figure 7
Figure 7. Fluoro-Jade B staining in the brain.
Confocal images taken at an excitation wavelength of 488 nm. Images are projections of seven confocal planes at a distance of 1 µm. (A) Telencephalon, (B) optic tectum, and (C) hindbrain from 21-week-old MZM-04/03. (D) Telencephalon, (E) optic tectum, and (F) hindbrain from 11-week-old MZM-04/03. (G) Telencephalon, (H) optic tectum, and (I) hindbrain from 11-week-old GRZ. White arrows denote labeled neuronal processes and arrowheads point to autofluorescent erythrocytes, which were excluded from the analysis.
Figure 8
Figure 8. Quantification of (A) Fluoro-Jade B and (B) lipofuscin staining in the brain as a percentage of the threshold area.
Data for the telencephalon, optic tectum and hindbrain are presented separately. Error bars represent the standard error of the mean. Significance is reported only for comparison between GRZ 11 weeks and MZM-04/03 11 weeks. Student's t-test, *P<0.05, **P<0.01.
Figure 9
Figure 9. Age-dependent decrease in exploratory activity.
Exploratory activity was measured in an open-field setting in terms of (A) mean velocity and (B) time spent moving. Error bars represent standard error of the mean. Sample size n = 10 for each age and population. Pairwise comparisons were performed exclusively within populations. Mann-Whitney U-test, **P<0.01, ***P<0.001.
Figure 10
Figure 10. Age-dependent cognitive deficit.
The average top scores of an active avoidance paradigm are reported. Error bars represent standard deviation. Rank-based ANOVA, **P<0.01; ns, not significant. Comparisons among strains at age 5 weeks are indicated by brackets. The symbols on the 9-weeks bars refer to comparison between the two ages within each strain. Sample size is 10 animals for each age and strain.

References

    1. Austad SN. On Herrera and Jagadeeswaran's “Annual fish as a genetic model for aging”. J Gerontol A Biol Sci Med Sci. 2004;59:99–100. - PubMed
    1. Genade T, Benedetti M, Terzibasi E, Roncaglia P, Valenzano DR, et al. Annual fishes of the genus Nothobranchius as a model system for aging research. Aging Cell. 2005;4:223–233. - PubMed
    1. Levels PJ, Gubbels RE, Denuce JM. Oxygen consumption during embryonic development of the annual fish Nothobranchius korthausae with special reference to diapause. Comp Biochem Physiol A. 1986;84:767–770. - PubMed
    1. Podrabsky JE, Hand SC. The bioenergetics of embryonic diapause in an annual killifish, austrofundulus limnaeus. J Exp Biol. 1999;202(Pt 19):2567–2580. - PubMed
    1. Hoback WW, Podrabsky JE, Higley LG, Stanley DW, Hand SC. Anoxia tolerance of con-familial tiger beetle larvae is associated with differences in energy flow and anaerobiosis. J Comp Physiol [B] 2000;170:307–314. - PubMed

Publication types