

Ovarian carcinoma subtypes are different diseases: implications for biomarker studies
- PMID: 19053170
- PMCID: PMC2592352
- DOI: 10.1371/journal.pmed.0050232
Ovarian carcinoma subtypes are different diseases: implications for biomarker studies
Abstract
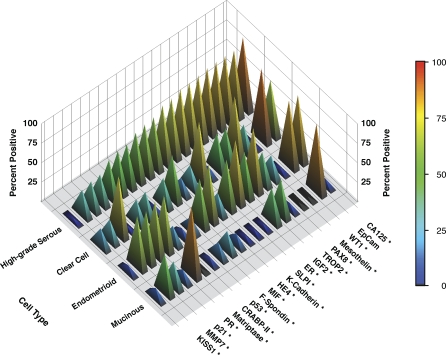
Background: Although it has long been appreciated that ovarian carcinoma subtypes (serous, clear cell, endometrioid, and mucinous) are associated with different natural histories, most ovarian carcinoma biomarker studies and current treatment protocols for women with this disease are not subtype specific. With the emergence of high-throughput molecular techniques, distinct pathogenetic pathways have been identified in these subtypes. We examined variation in biomarker expression rates between subtypes, and how this influences correlations between biomarker expression and stage at diagnosis or prognosis.
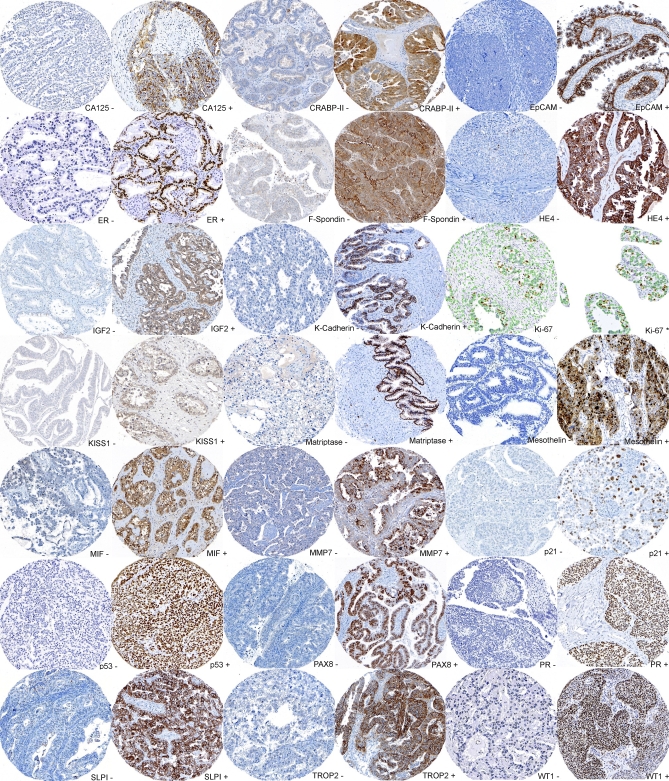
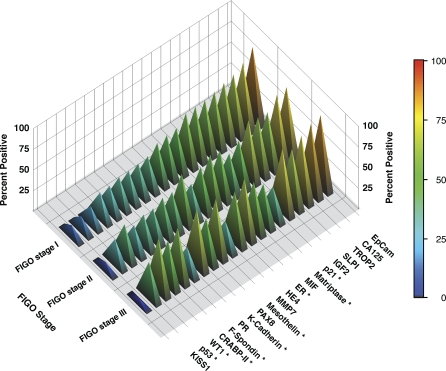
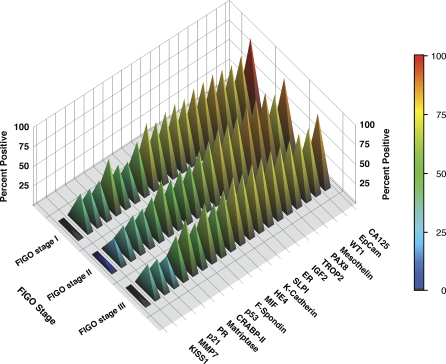
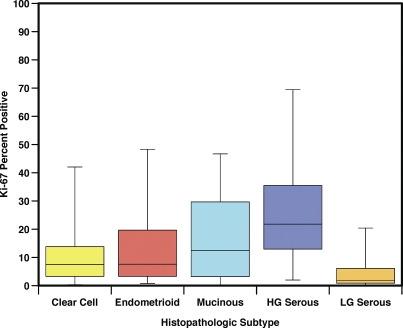
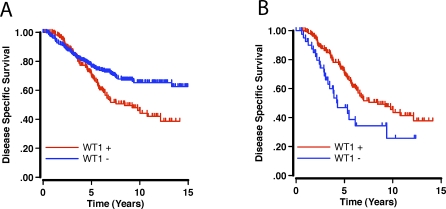
Methods and findings: In this retrospective study we assessed the protein expression of 21 candidate tissue-based biomarkers (CA125, CRABP-II, EpCam, ER, F-Spondin, HE4, IGF2, K-Cadherin, Ki-67, KISS1, Matriptase, Mesothelin, MIF, MMP7, p21, p53, PAX8, PR, SLPI, TROP2, WT1) in a population-based cohort of 500 ovarian carcinomas that was collected over the period from 1984 to 2000. The expression of 20 of the 21 biomarkers differs significantly between subtypes, but does not vary across stage within each subtype. Survival analyses show that nine of the 21 biomarkers are prognostic indicators in the entire cohort but when analyzed by subtype only three remain prognostic indicators in the high-grade serous and none in the clear cell subtype. For example, tumor proliferation, as assessed by Ki-67 staining, varies markedly between different subtypes and is an unfavourable prognostic marker in the entire cohort (risk ratio [RR] 1.7, 95% confidence interval [CI] 1.2%-2.4%) but is not of prognostic significance within any subtype. Prognostic associations can even show an inverse correlation within the entire cohort, when compared to a specific subtype. For example, WT1 is more frequently expressed in high-grade serous carcinomas, an aggressive subtype, and is an unfavourable prognostic marker within the entire cohort of ovarian carcinomas (RR 1.7, 95% CI 1.2%-2.3%), but is a favourable prognostic marker within the high-grade serous subtype (RR 0.5, 95% CI 0.3%-0.8%).
Conclusions: The association of biomarker expression with survival varies substantially between subtypes, and can easily be overlooked in whole cohort analyses. To avoid this effect, each subtype within a cohort should be analyzed discretely. Ovarian carcinoma subtypes are different diseases, and these differences should be reflected in clinical research study design and ultimately in the management of ovarian carcinoma.
Conflict of interest statement
Figures
References
-
- Narod SA, Boyd J. Current understanding of the epidemiology and clinical implications of BRCA1 and BRCA2 mutations for ovarian cancer. Curr Opin Obstet Gynecol. 2002;14:19–26. - PubMed
-
- Schwartz DR, Kardia SL, Shedden KA, Kuick R, Michailidis G, et al. Gene expression in ovarian cancer reflects both morphology and biological behavior, distinguishing clear cell from other poor-prognosis ovarian carcinomas. Cancer Res. 2002;62:4722–4729. - PubMed
-
- Zorn KK, Bonome T, Gangi L, Chandramouli GV, Awtrey CS, et al. Gene expression profiles of serous, endometrioid, and clear cell subtypes of ovarian and endometrial cancer. Clin Cancer Res. 2005;11:6422–6430. - PubMed
-
- Gilks CB, Ionescu D, Kalloger SE, Kobel M, Irving J, et al. Tumor cell type can reproducibly diagnosed and is of independent prognostic significance in patients with maximally debulked ovarian carcinoma. Hum Pathol. 2008;39:1239–1251. - PubMed
Publication types
MeSH terms
Substances
LinkOut - more resources
Full Text Sources
Other Literature Sources
Medical
Research Materials
Miscellaneous
