. 2008 Dec 2;6(12):2911-27.
doi: 10.1371/journal.pbio.0060306.

PcG proteins, DNA methylation, and gene repression by chromatin looping

Affiliations

PcG proteins, DNA methylation, and gene repression by chromatin looping

Vijay K Tiwari et al. PLoS Biol. .

Abstract

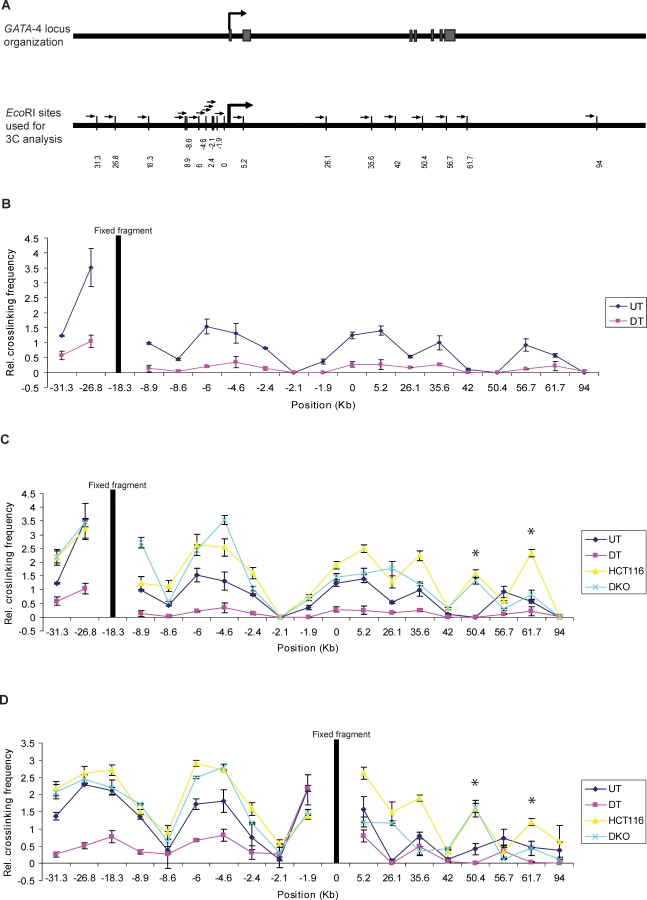
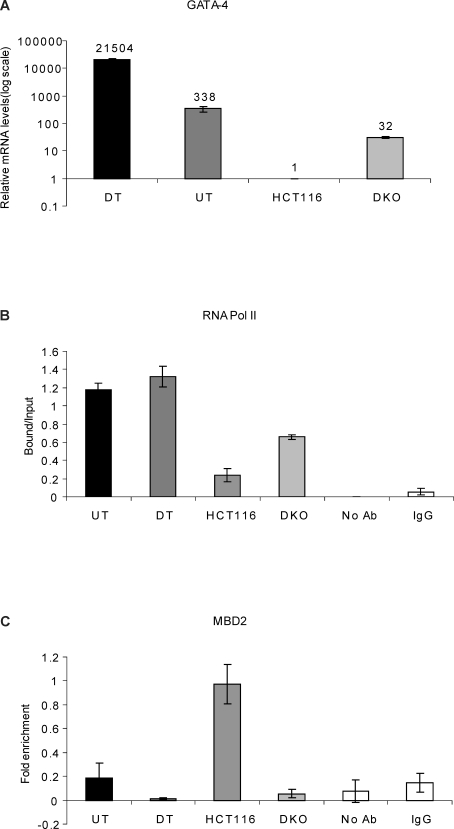
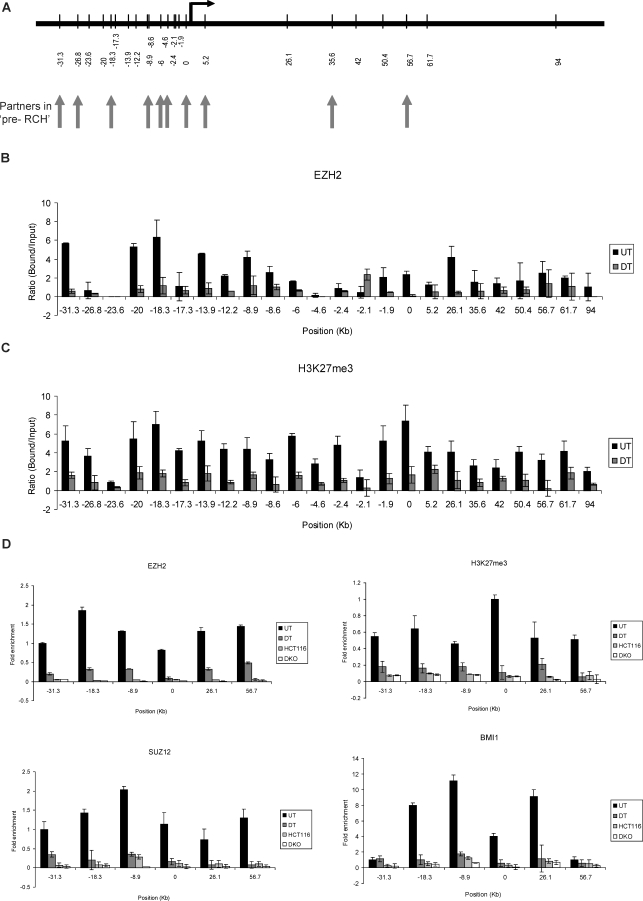
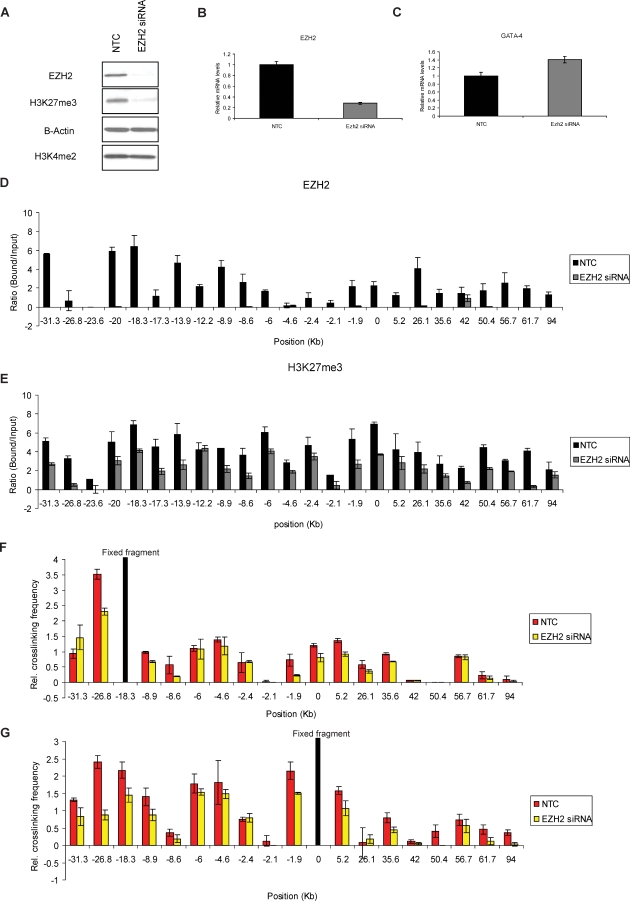
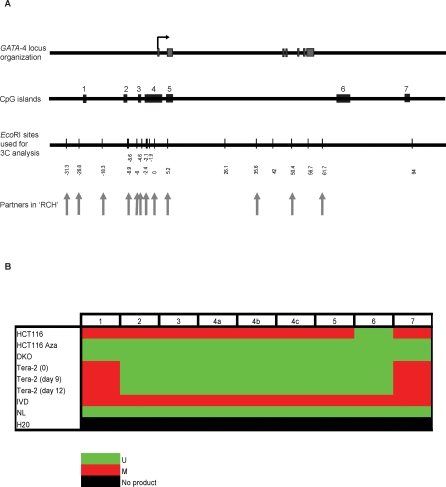
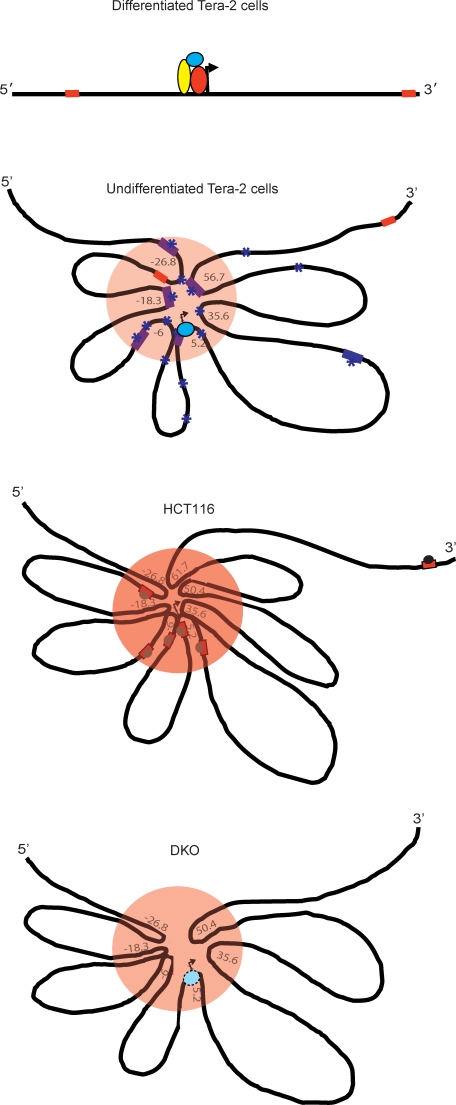
Many DNA hypermethylated and epigenetically silenced genes in adult cancers are Polycomb group (PcG) marked in embryonic stem (ES) cells. We show that a large region upstream ( approximately 30 kb) of and extending approximately 60 kb around one such gene, GATA-4, is organized-in Tera-2 undifferentiated embryonic carcinoma (EC) cells-in a topologically complex multi-loop conformation that is formed by multiple internal long-range contact regions near areas enriched for EZH2, other PcG proteins, and the signature PcG histone mark, H3K27me3. Small interfering RNA (siRNA)-mediated depletion of EZH2 in undifferentiated Tera-2 cells leads to a significant reduction in the frequency of long-range associations at the GATA-4 locus, seemingly dependent on affecting the H3K27me3 enrichments around those chromatin regions, accompanied by a modest increase in GATA-4 transcription. The chromatin loops completely dissolve, accompanied by loss of PcG proteins and H3K27me3 marks, when Tera-2 cells receive differentiation signals which induce a approximately 60-fold increase in GATA-4 expression. In colon cancer cells, however, the frequency of the long-range interactions are increased in a setting where GATA-4 has no basal transcription and the loops encompass multiple, abnormally DNA hypermethylated CpG islands, and the methyl-cytosine binding protein MBD2 is localized to these CpG islands, including ones near the gene promoter. Removing DNA methylation through genetic disruption of DNA methyltransferases (DKO cells) leads to loss of MBD2 occupancy and to a decrease in the frequency of long-range contacts, such that these now more resemble those in undifferentiated Tera-2 cells. Our findings reveal unexpected similarities in higher order chromatin conformation between stem/precursor cells and adult cancers. We also provide novel insight that PcG-occupied and H3K27me3-enriched regions can form chromatin loops and physically interact in cis around a single gene in mammalian cells. The loops associate with a poised, low transcription state in EC cells and, with the addition of DNA methylation, completely repressed transcription in adult cancer cells.


Conflict of interest statement

Competing interests. The authors have declared that no competing interests exist.

Figures

Figure 1
Figure 1. The Long-Range Chromatin Interactions at the GATA-4 Locus in Undifferentiated EC Cells, HCT116, and DKO Cells and Its Loss in Differentiated EC Cells, as Mapped by Chromosome Conformation Capture (3C) Assay
(A) Representation of the genomic organization of the human GATA-4 locus (upper panel) and EcoRI sites used for this study (small vertical bars, lower panel), with distance in kb along the x-axis (lower panel). The seven exons of the gene are shown as grey boxes, intervened by six introns. The large arrowhead represents the transcription start site. The gene spans approximately 55 kbp on 8p23.1–22. The EcoRI site nearest to the transcription start site is 0 on the x-axis. The fragments at −18.3 (B and C) and promoter (0) (D) were used as bait in the 3C assay for bidirectional search of physical partners. The small arrows next to each EcoRI site represent the location and the direction of primers used for the 3C assay in Figures 1 and 4. (B) The relative crosslinking frequency of different regions interacting with the −18.3 fragment (fixed fragment, the thick black line) across the GATA-4 locus in undifferentiated Tera-2 cells (blue dots) and is compared to EC cells differentiated by ATRA treatment (purple dots) . Standard error of the mean is indicated by the brackets around each dot, which represent the average derived from at least five independent samples. The value of relative crosslinking frequency is plotted on the y-axis and the locations of various EcoRI sites (in kb) used for the 3C analysis are plotted on the x-axis. The calculation of relative crosslinking frequency between two given GATA-4 fragments was done essentially as described by others [81], which allows a direct comparison between the different cell types used in the 3C assay by correcting for possible variants. ERCC3 fragments separated by approximately 10 kb were used for normalizing crosslinking frequency. UT= undifferentiated Tera-2 cells, DT= differentiated Tera-2 cells. (C) The spatial organization of the GATA-4 locus in the four cell types examined: HCT116, DKO, undifferentiated Tera-2, and differentiated Tera-2 cells. The graph is plotted similarly to (B) (for explanation of symbols, refer to (B)). Relative crosslinking frequencies of different regions with the −18.3 fragment in undifferentiated Tera-2 cells (UT), differentiated Tera-2 (DT), HCT116, and DKO cells are shown as blue, purple, yellow, and green dots, respectively, as indicated to the far right of the panel. The two novel interactions discovered in HCT116 cells, located at +50.4 and +61.7 kb, are marked by asterisks, one of which (+61.7 Kb) had reduced crosslinking frequency in DKO cells. (D) The results of 3C analysis in the four cell types using the promoter fragment (0) as bait, instead of the −18.3 fragment. The graph is plotted similarly to (B) (for explanation of symbols, refer to (B)). Relative crosslinking frequencies of different regions with the promoter (0) fragment in undifferentiated Tera-2 cells (UT), differentiated Tera-2 (DT), HCT116, and DKO cells are shown as blue, purple, yellow, and green dots, respectively, as indicated to the far right of the panel.
Figure 2
Figure 2. The Frequency of Long-Range Chromatin Interactions at the GATA-4 Locus Correlates with the Transcriptional Status of the Gene and Is Associated with the Differential Occupancy of RNA Pol II and MBD2 at the GATA-4 Promoter in the Four Cell Types
(A) Realtime RT-PCR analysis for relative comparison of GATA-4 transcript levels reveals differences among the four cell types- HCT116, DKO, undifferentiated Tera-2 and differentiated Tera-2 cells, which correspond well with the spatial organization of the GATA-4 locus. The numbers on top of the bars indicate fold up-regulation in GATA-4 mRNA levels in the three cell-types as compared to the HCT116 cells, which was just above a baseline value and is set to 1. Note that the relative mRNA levels on the y-axis are plotted logarithmically. (B) ChIP analysis for RNA Polymerase II occupancy at the GATA-4 promoter in undifferentiated Tera-2, differentiated Tera-2, HCT116, and DKO cells. ChIP was performed using antibodies against the initiating form of RNA Polymerase II followed by PCR using primers spanning the promoter region and the products were resolved on a 2% agarose gel and quantitated using KODAK Gel Logic 2000 imaging system. Average enrichments, from separate assays, are plotted on the y-axis as the ratio of precipitated DNA (bound) to the total input DNA (1:100 dilution) and are compared with the control samples (no antibody and IgG). Standard errors of the mean are indicated by the brackets. UT = undifferentiated Tera-2 cells, DT = differentiated Tera-2 cells. (C) MBD2 is enriched at the GATA-4 promoter region only in HCT116 cells and not in the other three cell types. ChIP was performed using antibody against MBD2, and the precipitated DNA was amplified by real-time qPCR using primers specific for the promoter CpG island in UT, DT, HCT116, and DKO cells. Enrichments are presented as folds of total input and are compared with the control samples (no antibody and IgG). Standard errors of the mean are indicated by the brackets. UT= undifferentiated Tera-2 cells, DT= differentiated Tera-2 cells.
Figure 3
Figure 3. PcG Proteins and Associated H3K27 Marks Occupy Broad Chromatin Domains throughout the GATA-4 Locus
(A) Schematic representation of location of various chromatin regions (in kb) at the human GATA-4 locus, queried by semiquantitative ChIP analysis for various components of the PcG repression system, including all the EcoRI enzyme sites used for the 3C analysis. The vertical arrows point towards the EcoRI sites that were discovered to be involved in long-range chromatin interactions in undifferentiated Tera-2 cells. (B and C) Quantitation of the gel-based PCR analysis of various fragments at the GATA-4 locus for EZH2 (B) and H3K27me3 (C) occupancy for undifferentiated and differentiated Tera-2 cells. Following the PCRs using primers spanning the EcoRI sites shown in (A), the products were resolved on a 2% agarose gel and quantitated using the KODAK Gel Logic 2000 imaging system. Average enrichments, from separate assays, are presented as the ratio of precipitated DNA (bound) to the total input DNA (1:100 dilution) and are plotted on the y-axis. Standard errors of the mean are indicated by the brackets. Black bars represent undifferentiated Tera-2 cells (UT), and grey bars represent differentiated Tera-2 cells (DT). (D) ChIP was performed using antibodies against EZH2, H3K27me3, SUZ12, and BMI1. The precipitated DNA was amplified by real-time qPCR using primers specific for some selected fragments (−31.3, −18.3, −8.9, 0, +26.1, and +56.7) in undifferentiated Tera-2 cells, differentiated Tera-2 cells, HCT116, and DKO cells. Enrichments are presented as folds of total input.
Figure 4
Figure 4. siRNA-Mediated Knockdown of EZH2 in Undifferentiated Tera-2 Cells Impairs Long-Range Associations at the GATA-4 Locus with Marginal Effect on GATA-4 Transcription
(A) Effects of the siRNA knockdown of EZH2 on EZH2 protein and the corresponding histone mark H3K27me3. For control assays, a random-sequence siRNA (NTC) was transfected in parallel. The overall levels of the active mark, H3K4me2, remain unaffected indicating that the targeting is specific for EZH2 and the subsequent effects on the H3K27me3 mark. (B) Effects of the siRNA knockdown on EZH2 mRNA levels and, in (C), on GATA-4 transcript levels. Transcription of GATA-4 is slightly increased in siRNA treated cells as compared to NTC (C). (D and E) Following ChIP assay, quantitation of the gel-based PCR analysis of various fragments at the GATA-4 locus was performed for EZH2 (D) and H3K27me3 (E) occupancy for NTC versus EZH2 siRNA treated Tera-2 cells. Following the PCRs using primers spanning EcoRI sites shown in Figure 3A, the products were resolved on a 2% agarose gel and quantitated using the KODAK Gel Logic 2000 imaging system. Average enrichments, from separate assays, are presented as the ratio of precipitated DNA (bound) to the total input DNA (1:100 dilution) and are plotted on the y-axis. Standard errors of the mean are indicated by the brackets. Black bars represent NTC and grey bars represent EZH2 siRNA treated Tera-2 cells. (F and G) 3C analysis using either the −18.3 fragment (F) or the promoter fragment (G) as bait indicates a noticeable reduction in the relative crosslinking frequency of certain regions in EZH2 siRNA treated cells as compared to NTC. The graph is plotted exactly as in Figure 1B with similar symbols.
Figure 5
Figure 5. Multiple CpG Islands Spread along the GATA-4 Locus Are Methylated in HCT116 Cells but Are Unmethylated in Undifferentiated Tera-2 Cells, Differentiated Tera-2 Cells, HCT116 Cells Treated with the Demethylating Agent 5-Aza-2′deoxycytidine, and DKO Cells
(A) The uppermost panel depicts the genomic organization of the human GATA-4 locus as in Figure 1A.The drawing below it shows the location of seven CpG islands used for MSP analysis with reference to the GATA-4 locus map shown above it. The third panel is a schematic representation of various EcoRI sites (thin bars) used in the 3C analysis, and the vertical arrows point toward the EcoRI sites that were discovered to be involved in long-range chromatin interactions in HCT116 cells. (B) The MSP results for all the 7 CpG islands are shown (island 1–7) for the four cell lines. CpG island 4 spanning the transcription start site, being very big, was split in three parts, 4a, 4b, and 4c for analysis. In vitro methylated DNA (IVD) and normal human peripheral lymphocytes (NL) served as the positive and negative methylation controls, respectively. The CpG islands 2 to 5 were methylated only in HCT116 cells but were unmethylated in undifferentiated Tera-2, differentiated Tera-2 (both day 9 and day 12 of ATRA induced differentiation), HCT116 cells treated with 5-Aza-2′deoxycytidine and DKO cells while CpG island 6 was always unmethylated in each of these cases. CpG islands 1 and 7 were methylated in HCT116, undifferentiated Tera-2 and differentiated Tera-2 cells but were unmethylated in HCT116 cells treated with 5-Aza-2′deoxycytidine and DKO cells. U = unmethylated (green color); M= fully methylated (red color); No product = H2O control (black color).
Figure 6
Figure 6. A Model for How the Spatial Chromatin Conformations Observed May Be Visualized around the GATA-4 Locus and Correlated with the Different Transcription States Seen in the Cells Studied
In the second panel (undifferentiated Tera-2 cells), the PcG-dependent long-range interactions, creating a pre-RCH (orange circle area) at the GATA-4 locus, are shown. This hub is associated with a poised transcription state, in which RNA Pol II is present at the promoter (sky blue oval), and low transcriptional activity. Purple squares and asterisks indicate regions showing strong enrichments for PcG proteins and repressive H3K27me3 marks respectively. Only the far upstream and most downstream CpG islands (CpG islands number 1 and 7 in Figure 5) are DNA methylated (red squares). This chromatin higher order structure is plastic in nature in the sense that the repressive hub can be dissolved when the cells are induced to high transcription of GATA-4 by differentiation cues in ATRA treatment of EC cells (differentiated Tera-2 cells, top panel). In this active state, PcG occupancy and H3K27me3 enrichment are severely diminished throughout the GATA-4 locus and the locus acquires an almost linear conformation. Such state of high transcription involves recruitment of other transcriptional coactivators (other colored ovals) to the RNA Pol II bound proximal promoter region around the transcription start site (indicated by the arrow) which are now made available and have access to the region in differentiated Tera-2 cells. The frequency of long-range interactions are depicted as increased, associated with DNA methylation of multiple CpG islands across a wide upstream region (red squares within the orange oval), forming a much tighter RCH in the HCT116 adult cancer cells (third panel). This state is accompanied by RNA Pol II exclusion and MBD2 recruitment (grey oval) at methylated CpG islands including the ones near the gene promoter. The result is severe repression of GATA-4 transcription to a fully silenced state. The multiple methylated MBD2-bound CpG islands are depicted as serving the same function as, or augmenting the effects of, the multiple PcG occupied and H3K27me3 enriched sites seen in undifferentiated Tera-2 cells. The bottommost panel shows the spatial organization of the locus for the state of GATA-4 in the isogenic cancer cell line of HCT116 (DKO) where knockout of DNA methyltransferases (DNMT1A/3B) (DKO) has induced overall depletion of DNA methylation. The long-range interactions in these cells are slightly destabilized, with decrease in the frequency of long-range chromatin interactions at several downstream fragments at the GATA-4 locus, including the promoter. The result is a higher order chromatin conformation state intermediate to that in the wild-type HCT116 cells (RCH) (above panel) and that in the undifferentiated Tera-2 cells (pre-RCH) (second from the top panel). The consequence is a modest enrichment of RNA Pol II at the promoter and return of the GATA-4 transcription to a more poised state with a low, but definite, level of expression.

Comment in

References

    1. Sparmann A, van Lohuizen M. Polycomb silencers control cell fate, development and cancer. Nat Rev Cancer. 2006;6:846–856. - PubMed
    1. Ringrose L. Polycomb comes of age: genome-wide profiling of target sites. Curr Opin Cell Biol. 2007;19:290–297. - PubMed
    1. Boyer LA, Plath K, Zeitlinger J, Brambrink T, Medeiros LA, et al. Polycomb complexes repress developmental regulators in murine embryonic stem cells. Nature. 2006;441:349–353. - PubMed
    1. Lee TI, Jenner RG, Boyer LA, Guenther MG, Levine SS, et al. Control of developmental regulators by Polycomb in human embryonic stem cells. Cell. 2006;125:301–313. - PMC - PubMed
    1. Bracken AP, Kleine-Kohlbrecher D, Dietrich N, Pasini D, Gargiulo G, et al. The Polycomb group proteins bind throughout the INK4A-ARF locus and are disassociated in senescent cells. Genes Dev. 2007;21:525–530. - PMC - PubMed

Publication types

MeSH terms