Comparative Study
. 2008 Dec 16;47(50):13318-25.
doi: 10.1021/bi801675a.

Interaction between cytochrome c2 and the photosynthetic reaction center from Rhodobacter sphaeroides: role of interprotein hydrogen bonds in binding and electron transfer

Affiliations
Comparative Study

Interaction between cytochrome c2 and the photosynthetic reaction center from Rhodobacter sphaeroides: role of interprotein hydrogen bonds in binding and electron transfer

Edward C Abresch et al. Biochemistry. .

Abstract

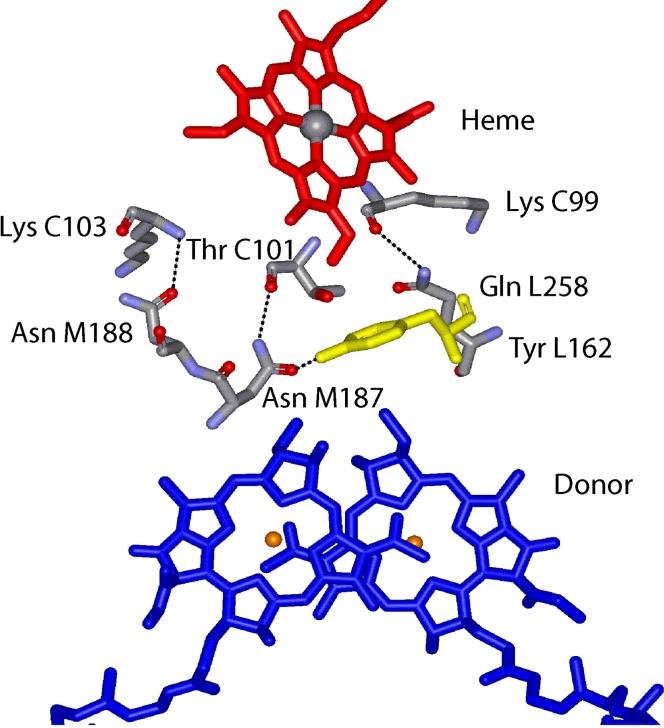
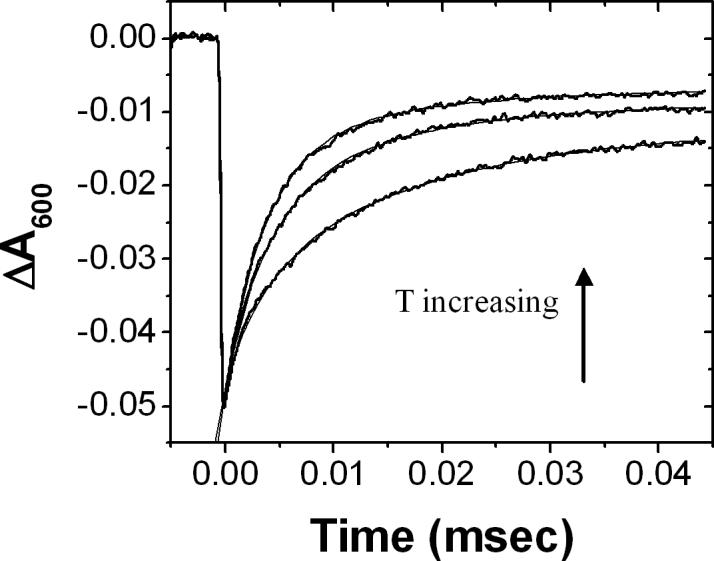
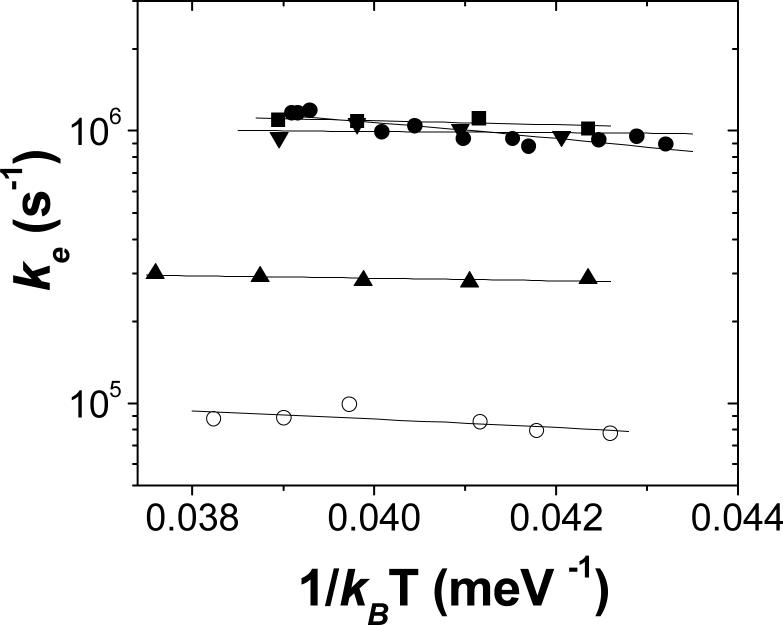
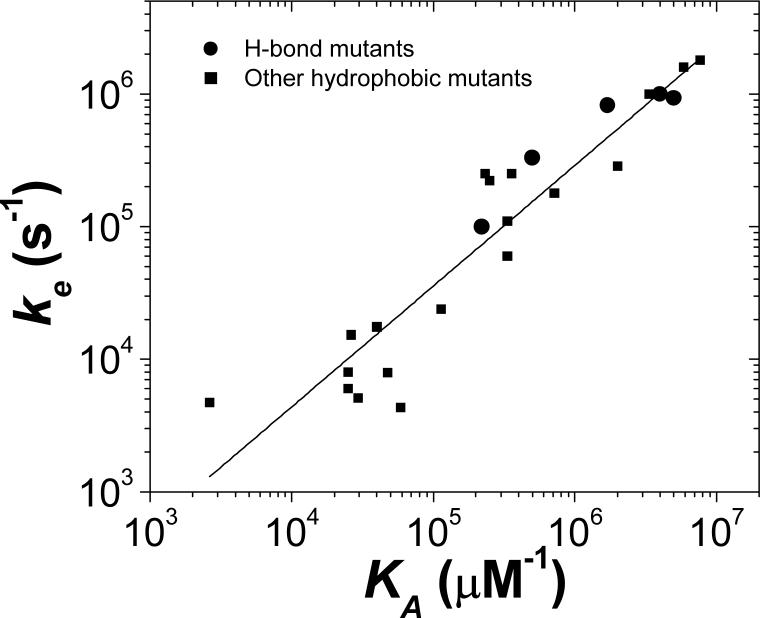
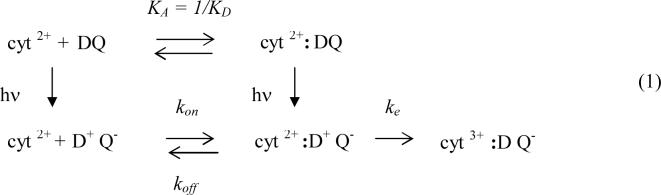
The role of short-range hydrogen bond interactions at the interface between electron transfer proteins cytochrome c(2) (cyt) and the reaction center (RC) from Rhodobacter sphaeroides was studied by mutation (to Ala) of RC residues Asn M187, Asn M188, and Gln L258 which form interprotein hydrogen bonds to cyt in the cyt-RC complex. The largest decrease in binding constant K(A) (8-fold) for a single mutation was observed for Asn M187, which forms an intraprotein hydrogen bond to the key residue Tyr L162 in the center of the contact region with a low solvent accessibility. Interaction between Asn M187 and Tyr L162 was also implicated in binding by double mutation of the two residues. The hydrogen bond mutations did not significantly change the second-order rate constant, k(2), indicating the mutations did not change the association rate for formation of the cyt-RC complex but increased the dissociation rate. The first-order electron transfer rate, k(e), for the cyt-RC complex was reduced by a factor of up to 4 (for Asn M187). The changes in k(e) were correlated with the changes in binding affinity but were not accompanied by increases in activation energy. We conclude that short-range hydrogen bond interactions contribute to the close packing of residues in the central contact region between the cyt and RC near Asn M187 and Tyr L162. The close packing contributes to fast electron transfer by increasing the rate of electronic coupling and contributes to the binding energy holding the cyt in position for times sufficient for electron transfer to occur.


Figures

Figure 1
Figure 1
Structure of the cyt c2:RC complex (PDB ID 1L9J) showing the inter-protein hydrogen bonds (dotted lines) from three amide residues on the RC to backbone atoms on the bound cyt c2. The redox active heme cofactor (red) on the cyt and the BChl2 donor (blue) on the RC, buried in their respective proteins, are in close contact with the key RC residue Tyr L162 (yellow) in the docked structure. (9)
Figure 2
Figure 2
Absorbance changes due to electron transfer from cyt c2 to NAM187 RC. In RC samples with no cyt c2, oxidation of D (monitored at 865 nm) is observed after a laser flash at t=0 with no recovery on this time scale. In the presence of cyt, two phases of recovery are observed: a fast phase near t=0, unresolved in these traces due to rapid electron transfer ( τ ∼ 4 μs) from bound cyt (See Fig. 4) and a slow phase due to second order electron transfer from unbound cyt. The fraction of fast component and the rate of the slow phase increase with increasing cyt concentration and were used to determine KA and k2. The RC concentration was 0.3 μM and the values for the free cyt are as indicated. (10 mM Hepes and 0.04% β-maltoside at pH 7.5, T=23 C)
Figure 3
Figure 3
Plot of the fraction of RCs with bound cyt c2, versus the free cyt c2 concentration for native and mutant RCs. The symbols for different RCs are: native (●), NA(M188) (■), QA(L258) (▼), NA(M187) (▲) and the triple mutant (o). The curves are the fits of equation 3 to the measured data for each RC. The values determined for KA are shown in Table 1. The triple mutant has the largest decrease binding affinity. (Conditions: 0.2 μM RC in 10 mM Hepes and 0.04% β-maltoside at pH 7.5.)
Figure 4
Figure 4
Absorbance changes due to electron transfer monitored at 600nm for a) native and b) NA(M187) RCs in the presence of high concentration of cyt c2. The electron transfer rate in the mutant RCs were slower than in Native RCs. (Note the difference in time scales). The native RC = 3.5 μM and cyt = 70μM. The NAM187 RC = 4μM and cyt = 100μM. The data were fit with equation 3. For native RCs, ke = 106 s−1(75%), ks = 3×10⁴ s−1 (25%) and for NA(M187) RCs, ke = 0.26×10⁶ s−1 (80%), ks =5×10⁴ s−1(20%). (10 mM Hepes and 0.04% β-maltoside at pH 7.5, T=26 C)
Figure 5
Figure 5
Temperature dependence of fast electron transfer between cyt and NA M187 RC. The data is shown for the electron transfer at T= 1, 18, and 36 °C (increasing from bottom to top). The decrease in rate at low temperature is due mainly to an decrease in the fraction of RCs with bound cyt. The rate of the fast component was relatively temperature independent. (Figure 6) Other conditions same as for Figure 4.
Figure 6
Figure 6
Plot of ke versus 1/kBT for native and mutant RCs. The symbols for different RCs are: native (●), NA(M188) (■), QA(L258) (▼), NA(M187) (▲) and the triple mutant (o). The slope of the line fit to the data were used to obtain the activation energy Ea for electron transfer (Table 1). (Conditions: 3 μM RC in 10 mM Hepes and 0.04% β-maltoside at pH 7.5.)
Figure 7
Figure 7
The cyt c2 :RC first order electron transfer rate constant ke versus the binding constant KA for native and mutant RCs. The rates for H-bond mutants determined in this study (●) are plotted with rates previously determined (■) for hydrophobic mutant RCs (11). The H-bond mutants follow the same general trend in which changes in ke are roughly proportional to changes in KA
None

References

    1. Bendall D. In: Protein electron transfer. Bendall D, editor. Bios Scientific Publishers Ltd; Oxford, UK: 1996. pp. 43–68.
    1. Blankenship RE. Molecular mechanisms of photosynthesis. Blackwell Science Inc; London: 2002.
    1. Dutton PL, Prince RC. In: The photosynthetic bacteria. Clayton RC, W. R. S., editors. Plenum Press; New York: 1978. pp. 525–570.
    1. Tiede D, Dutton P. In: The photosynthetic reaction center. Deisenhofer J, Norris J, editors. Academic Press; San Diego: 1993. pp. 258–288.
    1. Overfield RE, Wraight CA, Devault DC. Microsecond photooxidation kinetics of cytochrome c2 from rhodopseudomonas sphaeroides: In vivo and solution studies. FEBS Lett. 1979;105:137–142. - PubMed

Publication types

MeSH terms

Substances

Associated data

LinkOut - more resources