

Empirical amide I vibrational frequency map: application to 2D-IR line shapes for isotope-edited membrane peptide bundles
- PMID: 19053670
- PMCID: PMC2633092
- DOI: 10.1021/jp807528q
Empirical amide I vibrational frequency map: application to 2D-IR line shapes for isotope-edited membrane peptide bundles
Abstract
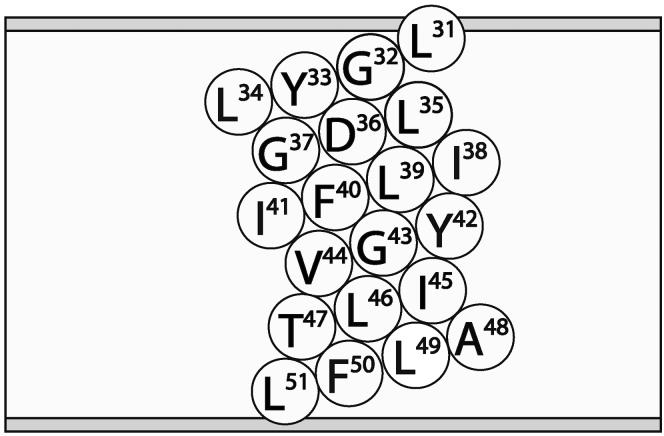
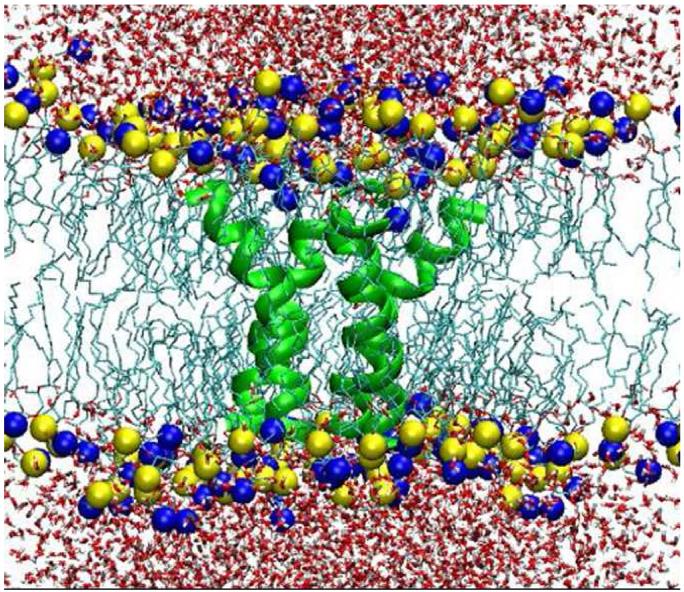
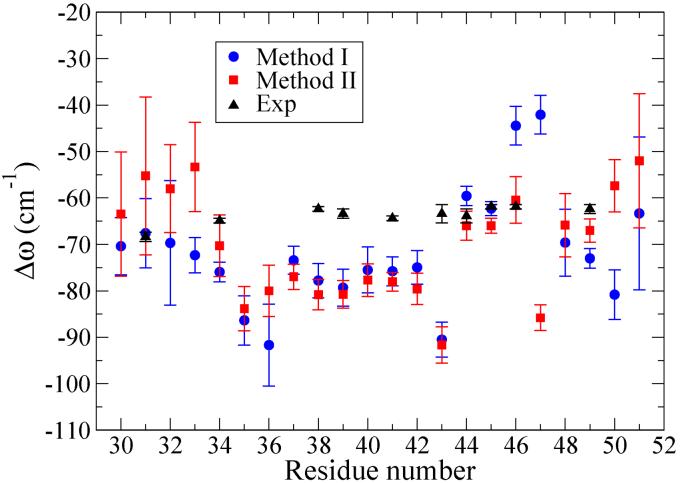
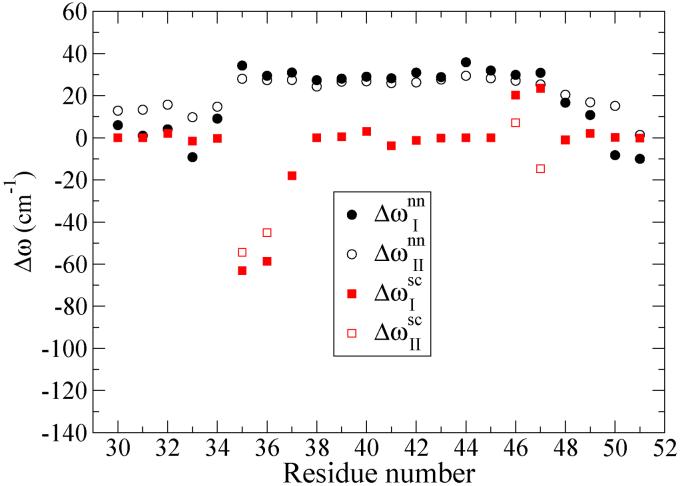
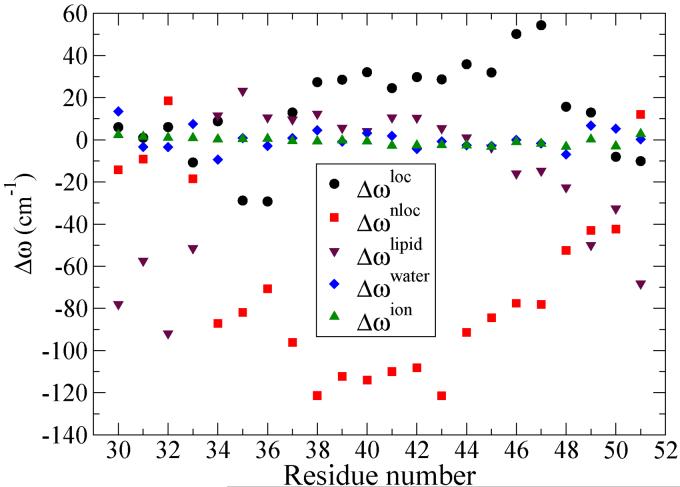
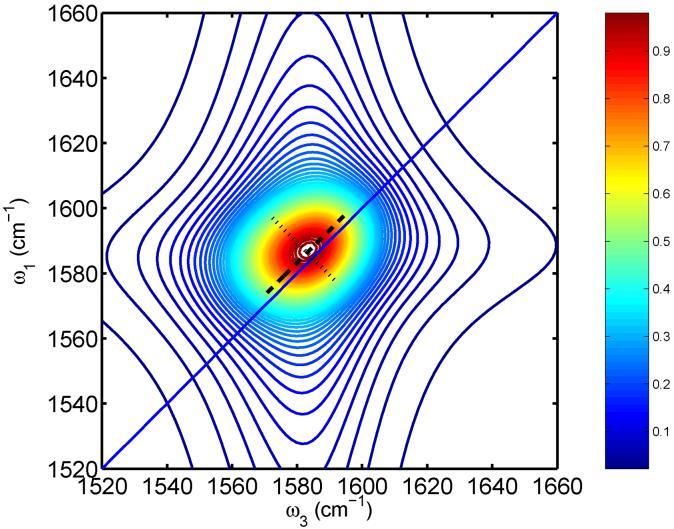
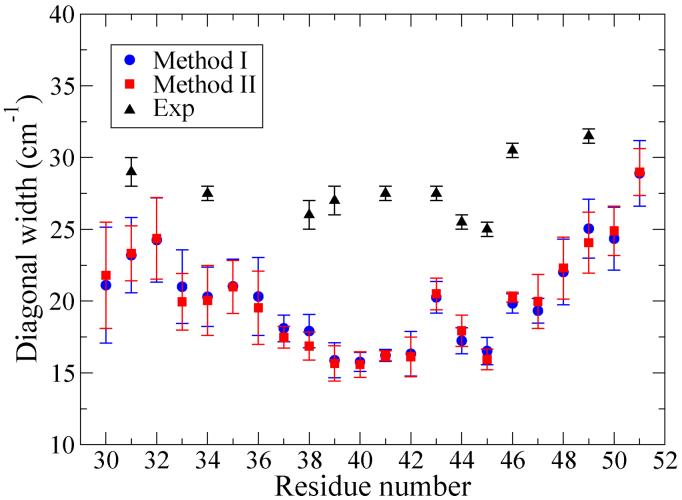
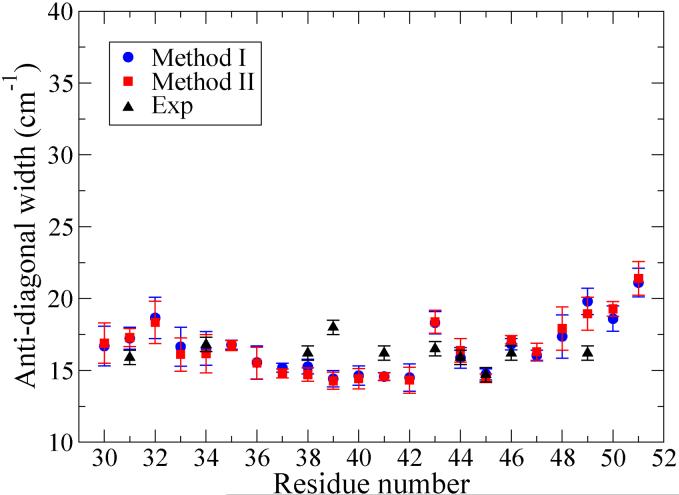
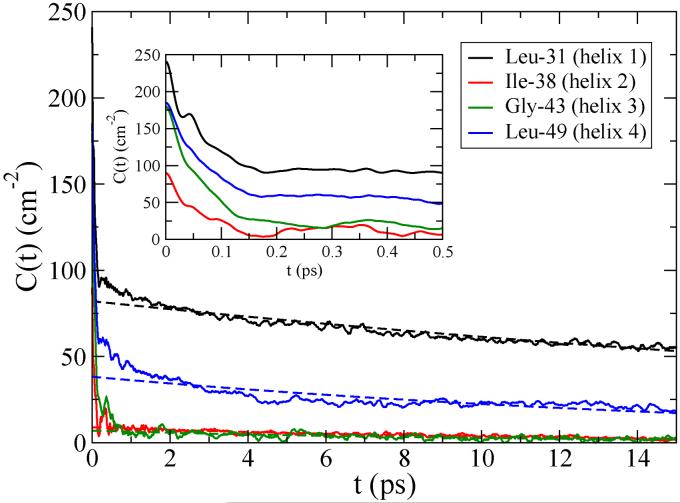
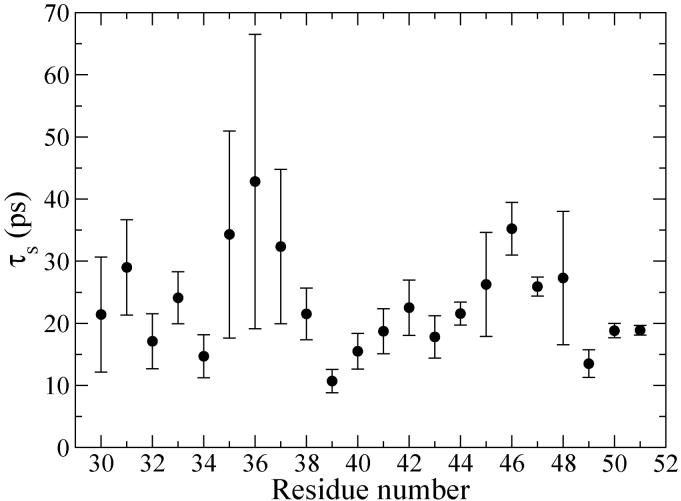
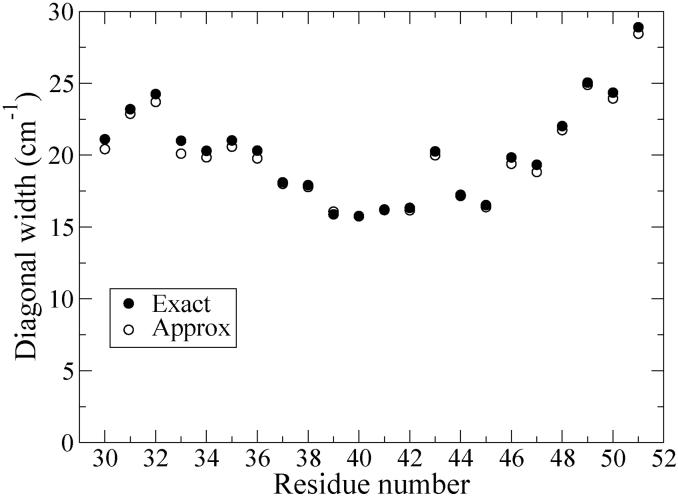
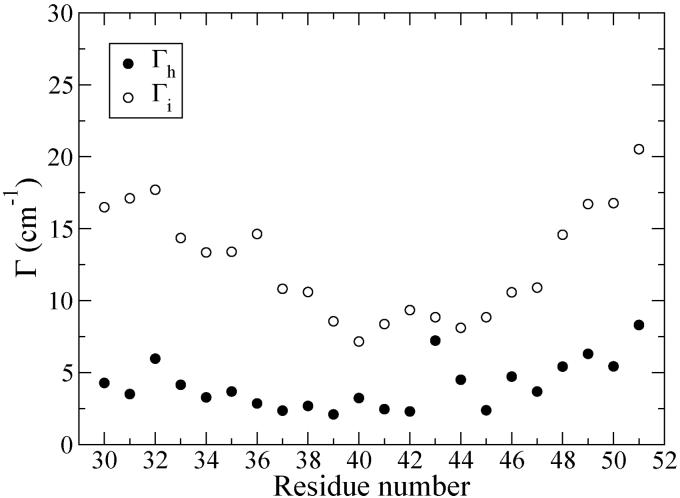
The amide I vibrational mode, primarily associated with peptide-bond carbonyl stretches, has long been used to probe the structures and dynamics of peptides and proteins by infrared (IR) spectroscopy. A number of ab initio-based amide I vibrational frequency maps have been developed for calculating IR line shapes. In this paper, a new empirical amide I vibrational frequency map is developed. To evaluate its performance, we applied this map to a system of isotope-edited CD3-zeta membrane peptide bundles in aqueous solution. The calculated 2D-IR diagonal line widths vary from residue to residue and show an asymmetric pattern as a function of position in the membrane. The theoretical results are in fair agreement with experiments on the same system. Through analysis of the computed frequency time-correlation functions, it is found that the 2D-IR diagonal widths are dominated by contributions from the inhomogeneous frequency distributions, from which it follows that these widths are a good probe of the extent of local structural fluctuations. Thus, the asymmetric pattern of line widths follows from the asymmetric structure of the bundle in the membrane.
Figures
Similar articles
-
Structural disorder of the CD3zeta transmembrane domain studied with 2D IR spectroscopy and molecular dynamics simulations.J Phys Chem B. 2006 Dec 7;110(48):24740-9. doi: 10.1021/jp0640530. J Phys Chem B. 2006. PMID: 17134238 Free PMC article.
-
Amide I two-dimensional infrared spectroscopy of proteins.Acc Chem Res. 2008 Mar;41(3):432-41. doi: 10.1021/ar700188n. Epub 2008 Feb 21. Acc Chem Res. 2008. PMID: 18288813 Review.
-
Two-dimensional infrared spectroscopy as a probe of the solvent electrostatic field for a twelve residue peptide.J Phys Chem B. 2008 May 15;112(19):5930-7. doi: 10.1021/jp075683k. Epub 2007 Dec 14. J Phys Chem B. 2008. PMID: 18078331 Free PMC article.
-
Dual-frequency 2D-IR spectroscopy heterodyned photon echo of the peptide bond.Proc Natl Acad Sci U S A. 2003 May 13;100(10):5601-6. doi: 10.1073/pnas.0931292100. Epub 2003 Apr 22. Proc Natl Acad Sci U S A. 2003. PMID: 12709595 Free PMC article.
-
Using 2D-IR Spectroscopy to Measure the Structure, Dynamics, and Intermolecular Interactions of Proteins in H2O.Acc Chem Res. 2024 Mar 5;57(5):685-692. doi: 10.1021/acs.accounts.3c00682. Epub 2024 Feb 16. Acc Chem Res. 2024. PMID: 38364823 Free PMC article. Review.
Cited by
-
Distinguishing gramicidin D conformers through two-dimensional infrared spectroscopy of vibrational excitons.J Chem Phys. 2015 Jun 7;142(21):212424. doi: 10.1063/1.4917321. J Chem Phys. 2015. PMID: 26049444 Free PMC article.
-
Microscopic insights into the protein-stabilizing effect of trimethylamine N-oxide (TMAO).Proc Natl Acad Sci U S A. 2014 Jun 10;111(23):8476-81. doi: 10.1073/pnas.1403224111. Epub 2014 May 27. Proc Natl Acad Sci U S A. 2014. PMID: 24912147 Free PMC article.
-
Interplay between Hydrogen Bonding and Vibrational Coupling in Liquid N-Methylacetamide.J Phys Chem Lett. 2017 Jun 1;8(11):2438-2444. doi: 10.1021/acs.jpclett.7b00731. Epub 2017 May 19. J Phys Chem Lett. 2017. PMID: 28510458 Free PMC article.
-
A new computational methodology for the characterization of complex molecular environments using IR spectroscopy: bridging the gap between experiments and computations.Chem Sci. 2024 Aug 13;15(35):14440-8. doi: 10.1039/d4sc03219e. Online ahead of print. Chem Sci. 2024. PMID: 39156932 Free PMC article.
-
Vibrational characterization of simple peptides using cryogenic infrared photodissociation of H2-tagged, mass-selected ions.J Am Chem Soc. 2011 Apr 27;133(16):6440-8. doi: 10.1021/ja200849g. Epub 2011 Mar 30. J Am Chem Soc. 2011. PMID: 21449591 Free PMC article.
References
-
- Schrader B. Infrared and Raman Spectroscopy: Methods and Applications. VCH; Weinheim: 1995.
-
- Gremlich H-U, Yan B. Infrared and Raman Spectroscopy of Biological Materials. Marcel Dekker; New York: 2001.
-
- Stuart B. Infrared Spectroscopy: Fundamentals and Applications. Wiley; Chichester, West Sussex, England; Hoboken, NJ: 2004.
-
- Mukamel S. Annu. Rev. Phys. Chem. 2000;51:691. - PubMed
Publication types
MeSH terms
Substances
Grants and funding
LinkOut - more resources
Full Text Sources
Other Literature Sources
