Review
. 2009 Jan;33(1):66-97.
doi: 10.1111/j.1574-6976.2008.00141.x. Epub 2008 Nov 27.

Computational and experimental approaches to chart the Escherichia coli cell-envelope-associated proteome and interactome

Affiliations
Review

Computational and experimental approaches to chart the Escherichia coli cell-envelope-associated proteome and interactome

Juan Javier Díaz-Mejía et al. FEMS Microbiol Rev. 2009 Jan.

Abstract

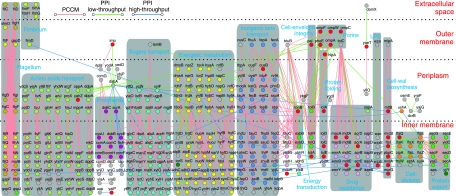
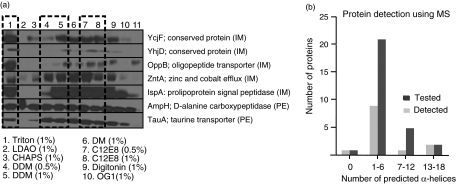
The bacterial cell-envelope consists of a complex arrangement of lipids, proteins and carbohydrates that serves as the interface between a microorganism and its environment or, with pathogens, a human host. Escherichia coli has long been investigated as a leading model system to elucidate the fundamental mechanisms underlying microbial cell-envelope biology. This includes extensive descriptions of the molecular identities, biochemical activities and evolutionary trajectories of integral transmembrane proteins, many of which play critical roles in infectious disease and antibiotic resistance. Strikingly, however, only half of the c. 1200 putative cell-envelope-related proteins of E. coli currently have experimentally attributed functions, indicating an opportunity for discovery. In this review, we summarize the state of the art of computational and proteomic approaches for determining the components of the E. coli cell-envelope proteome, as well as exploring the physical and functional interactions that underlie its biogenesis and functionality. We also provide a comprehensive comparative benchmarking analysis on the performance of different bioinformatic and proteomic methods commonly used to determine the subcellular localization of bacterial proteins.


Figures

Fig. 1
Fig. 1
A general functional classification of the Escherichia coli cell-envelope related proteome. A set of 1179 proteins tentatively forming the cell-envelope proteome of E. coli K-12 (substrain W3110) was selected combining the results of four different predictors of protein global subcellular localization by ‘Majority Consensus’ (see section ‘Majority Consensus’ improves the prediction of global subcellular localization for details). The number of proteins for each compartment forming the ‘Majority Consensus’ is shown in parentheses. Fractions represent the number of proteins in each functional category – according to the COGs database (Tatusov et al., 2000) – divided by the total number of E. coli proteins in the respective category. In comparison with the cytoplasmic proteins (the remaining fraction not shown in each functional category), the cell-envelope proteome is markedly enriched in proteins with an unknown function (c. 70%). Two COG categories, namely Translation and DNA replication, recombination and repair, are not shown, as none of these 1179 proteins is classified into such categories. IM, inner membrane; PE, periplasmic; OM, outer membrane; EC, extracellular.
Fig. 2
Fig. 2
A middle-level functional classification of the E. coli cell-envelope-related proteome. The 1179 proteins in the ‘Majority Consensus’ tentatively forming the cell-envelope proteome of E. coli K-12 were mapped against the middle-level terms in the hierarchy of functional annotations in the database MultiFun (Serres et al., 2004). Fractions represent the number of cell-envelope proteins for each MultiFun functional category, divided by the total number of E. coli proteins in the respective category. Only categories with fractions of tentative cell-envelope proteins >0.2 are shown. Subcellular localization acronyms are described as in Fig. 1. Struct, Structural components; Inf, inner membrane protein folding.
Fig. 3
Fig. 3
‘Agreement’ analysis between pairs of bioinformatic predictors of protein subcellular localization. The 4220 proteins forming the E. coli K-12 proteome were subjected to prediction of global subcellular localization (*) and specific features (α-helices, β-barrels and signal peptides) by different computational methods. Each square in the matrix represents the number of proteins predicted to be located in a given compartment by any two predictors (P1 and P2). Results from P1 are plotted on the x-axis, while predictions of P2 are plotted on the y-axis. The number of predicted proteins for each subcellular location by each method is shown in parentheses. The darker the square intersecting any two methods, the higher the ‘Agreement’ between them (see section ‘Statistical parameters to evaluate the performance of predictors of subcellular localization’ for details). Major discrepancies between methods are highlighted in red frames. TIMP α-helix predictors were evaluated for one or more helices (≥1 TMHs) and for two or more helices (≥2 TMHs); only the option with a higher ‘Performance’ (Table 2) is shown. CY, cytoplasmic; SP, signal peptide;‘?’ refers to proteins with no predicted localization. Other subcellular localization acronyms are described as in Fig. 1. Subcellular localization predictions and ‘Agreement’ values used to construct this plot are available in Table S1.
Fig. 4
Fig. 4
‘Agreement’ analysis between pairs of proteomic, bioinformatic tools and knowledge databases predicting or describing the E. coli cell-envelope-related proteome. Bioinformatic methods are represented by the ‘Majority Consensus’ of predictors of global subcellular localization (*). Proteomic studies are denoted by ‘p’, gold standard reference databases of protein subcellular localization are denoted by ‘g’ and other databases by ‘d’. Each square in the matrix represents the number of proteins predicted or described to be located in a given compartment by any two data sources. The darker the square intersecting any two data sources (D1 and D2), the higher the ‘Agreement’ between them (see section ‘Statistical parameters to evaluate the performance of predictors of subcellular localization’ for details). Predictions or descriptions of D1 are plotted on the x-axis, while predictions or descriptions of D2 are plotted on the y-axis. The number of predicted proteins for each subcellular location is shown in parentheses. Major discrepancies between datasources are highlighted in red frames. The list of cell-envelope proteins according to different proteomic methods is shown in Table S1. Subcellular localization acronyms are described as in Figs 1 and 3.
Fig. 5
Fig. 5
A census of the cell-envelope-related PPIs and protein complexes in knowledge databases. PPIs contained in the DIP, BIND and IntAct databases were filtered to obtain interactions derived from low-throughput (PPI_lt) and high-throughput (PPI_ht) experiments. Protein complex co-memberships (PCCM) annotated in the databases EcoCyc and TCDB are shown as edges connecting all-against-all proteins (nodes) forming a complex. Only interactions between proteins predicted as cell-envelope related according to the ‘Majority Consensus’ of predictors of global subcellular localization are shown. Node colors denote COG functional assignments, with the exception of grey nodes, where the poorly characterized proteins were assigned to categories ‘R and S, denoting proteins of no COG functional assignment. Proteins with grey nodes, depicted by blue labels, correspond to MultiFun functional assignments. Proteins depicted in red nodes were categorized under cell-envelope and OM biogenesis based on the COG functional assignment.
Fig. 6
Fig. 6
Selection of cell-envelope candidates for affinity tagging and purification using bioinformatic and proteomic data sources. (a) Western blotting of E. coli SPA-tagged TIMP and periplasmic proteins solubilized with eight different detergents, detected for the presence of the SPA-tag using an anti-FLAG antibody. The concentration of detergent used in the purification is shown in parentheses. The three detergents most effectively solubilizing the membrane proteins are indicated in a rectangular box with broken lines. The set of 34 candidates comprising of TIMP and periplasmic proteins was selected according to the predicted number of transmembrane α-helices and signal peptides, respectively, based on Phobius predictions (see Table S1 for the list). (b) SPA-purified E. coli membrane protein baits identified by mass spectrometry. The bar graph shows the recovery and detection coverage for affinity-tagged and -purified E. coli TIMP baits spanning both single membrane and polytopic (>10-TMH) transmembrane helices identified by MS. DM, n-dodecyl-β-d-maltoside. The acronyms of the other chemicals are described in the text.

Similar articles

Cited by

References

    1. Aggarwal K, Choe LH, Lee KH. Quantitative analysis of protein expression using amine-specific isobaric tags in Escherichia coli cells expressing rhsA elements. Proteomics. 2005;5:2297–2308. - PubMed
    1. Alami M, Dalal K, Lelj-Garolla B, Sligar SG, Duong F. Nanodiscs unravel the interaction between the SecYEG channel and its cytosolic partner SecA. EMBO J. 2007;26:1995–2004. - PMC - PubMed
    1. Alexander RP, Zhulin IB. Evolutionary genomics reveals conserved structural determinants of signaling and adaptation in microbial chemoreceptors. P Natl Acad Sci USA. 2007;104:2885–2890. - PMC - PubMed
    1. Altschul SF, Madden TL, Schaffer AA, Zhang J, Zhang Z, Miller W, Lipman DJ. Gapped BLAST and PSI-BLAST: a new generation of protein database search programs. Nucleic Acids Res. 1997;25:3389–3402. - PMC - PubMed
    1. Andrade MA, Brown NP, Leroy C, et al. Automated genome sequence analysis and annotation. Bioinformatics. 1999;15:391–412. - PubMed

MeSH terms

LinkOut - more resources