. 2008 Dec 4:9:519.
doi: 10.1186/1471-2105-9-519.

Integrated multi-level quality control for proteomic profiling studies using mass spectrometry

Affiliations

Integrated multi-level quality control for proteomic profiling studies using mass spectrometry

David A Cairns et al. BMC Bioinformatics. .

Abstract

Background: Proteomic profiling using mass spectrometry (MS) is one of the most promising methods for the analysis of complex biological samples such as urine, serum and tissue for biomarker discovery. Such experiments are often conducted using MALDI-TOF (matrix-assisted laser desorption/ionisation time-of-flight) and SELDI-TOF (surface-enhanced laser desorption/ionisation time-of-flight) MS. Using such profiling methods it is possible to identify changes in protein expression that differentiate disease states and individual proteins or patterns that may be useful as potential biomarkers. However, the incorporation of quality control (QC) processes that allow the identification of low quality spectra reliably and hence allow the removal of such data before further analysis is often overlooked. In this paper we describe rigorous methods for the assessment of quality of spectral data. These procedures are presented in a user-friendly, web-based program. The data obtained post-QC is then examined using variance components analysis to quantify the amount of variance due to some of the factors in the experimental design.

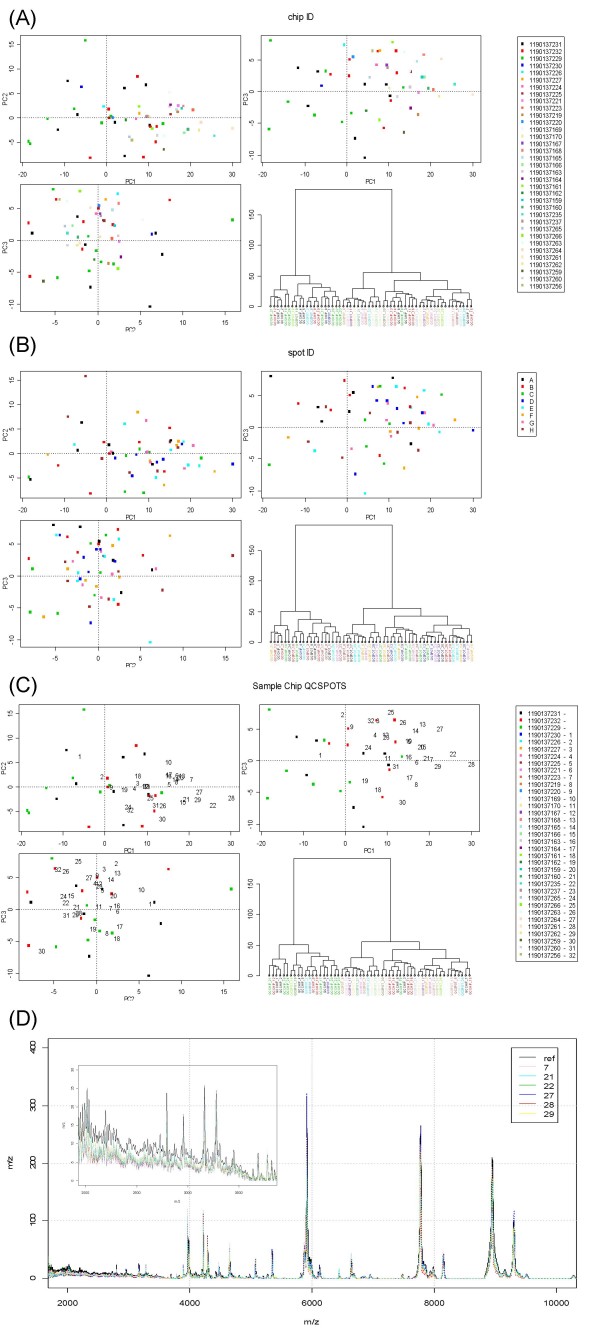
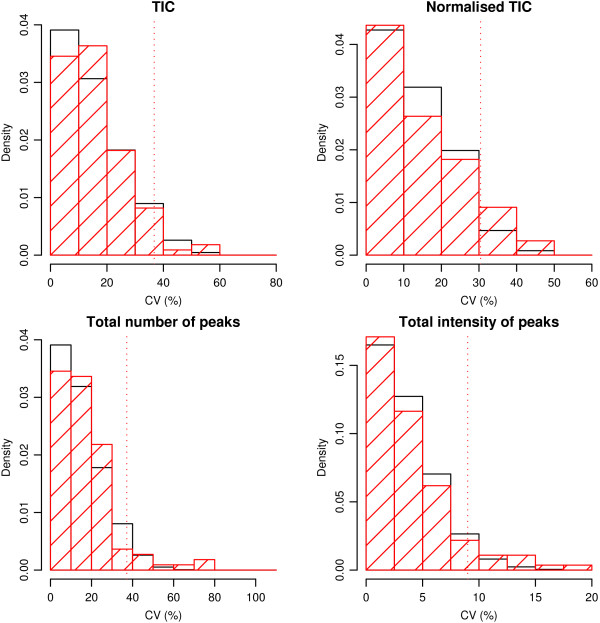
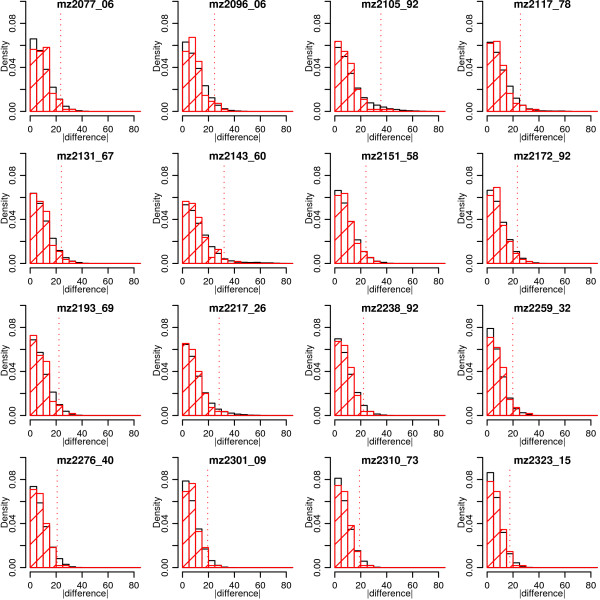
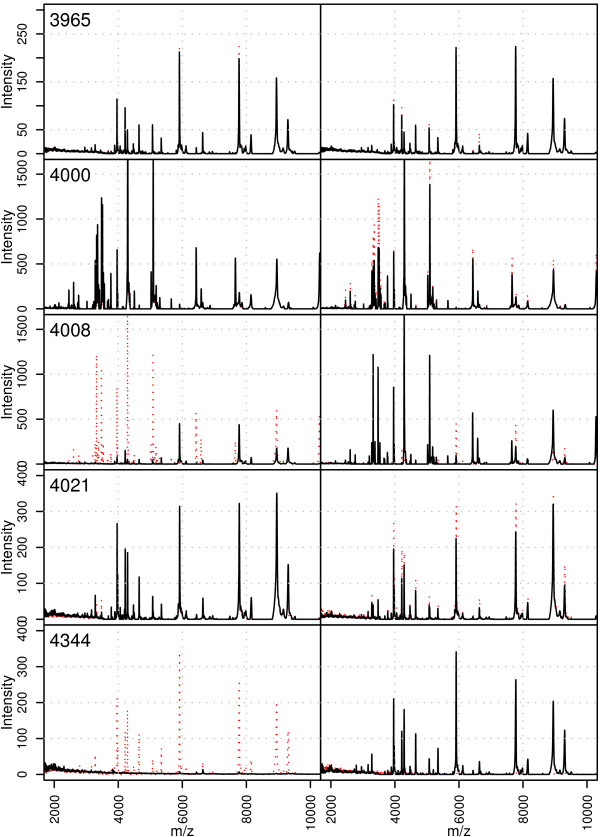
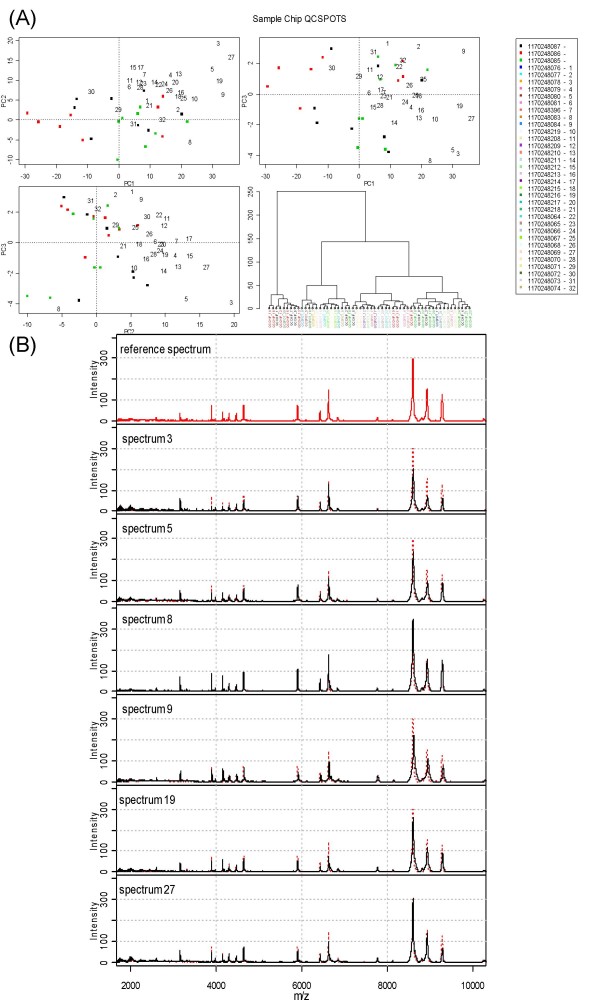
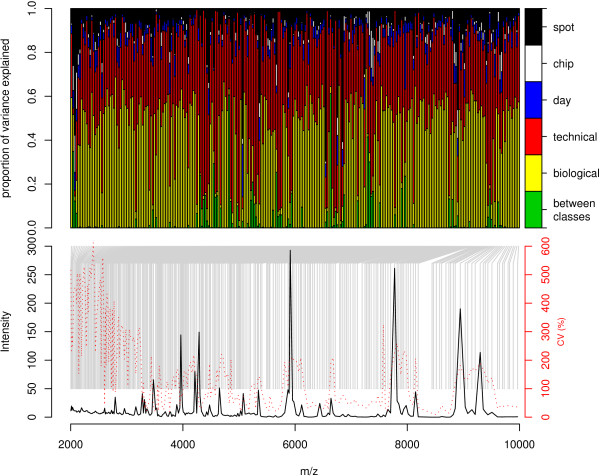
Results: Using data from a SELDI profiling study of serum from patients with different levels of renal function, we show how the algorithms described in this paper may be used to detect systematic variability within and between sample replicates, pooled samples and SELDI chips and spots. Manual inspection of those spectral data that were identified as being of poor quality confirmed the efficacy of the algorithms. Variance components analysis demonstrated the relatively small amount of technical variance attributable to day of profile generation and experimental array.

Conclusion: Using the techniques described in this paper it is possible to reliably detect poor quality data within proteomic profiling experiments undertaken by MS. The removal of these spectra at the initial stages of the analysis substantially improves the confidence of putative biomarker identification and allows inter-experimental comparisons to be carried out with greater confidence.


Figures

Figure 1
Figure 1
QC tool output for section of study of patients with different levels of renal function using IMAC-Cu ProteinChips. Pair-wise plots of the first two principal components (PCs) and a dendrogram showing results of hierarchical clustering using Ward's agglomeration method and the Euclidean distance metric are shown in each panel. Panel (A) shows the plots with the chip ID number indicated by plotting character. The reference set chips are indicated with red, black and green plotting characters and subsequent projections described in the legend. Panel (B) shows the plots with the spot indicated. Panel (C) shows the plots with the reference set indicated by solid plotting characters (red, green and black as in panel (A)) and numbers plotted representing order of QC spectra on sample chips. Panel (D) shows the mean spectra obtained from samples in the reference set and also individual spectra which appear to be on the edge of the PC space in the PC plots in panel (C). The inset plot in panel (D) shows an expanded region of the spectra where the differences from the reference spectra can be observed.
Figure 2
Figure 2
The black solid bars indicate histograms of coefficient of variations expressed as percentages (CVs) for all possible pairs of QC spectra for the variables of interest in the 2–4 kDa mass region (clockwise from top left, TIC, normalised TIC, total intensity of peaks and total number of peaks). The dotted line perpendicular to the abscissa indicates the critical value for these empirical significance tests based on the 95% quantile of these measures. The red hatched histograms shows the distribution of CVs calculated for the duplicate technical replicates. CVs which are greater than the critical value will be rejected at the 5% level. These QC fails will be indicated by crosses in Table 1.
Figure 3
Figure 3
Demonstration of absolute difference in technical replicate peaks empirical significance methods for 16 conveniently chosen peaks in the 2–4 kDa mass segment. Solid black histograms show the reference distribution in black with the actual differences indicated by the red hatched histogram bars. Values greater than the critical value (indicated by red dotted line from the abscissa) result in a significant difference in a pair of technical replicates being declared. The percentage of peaks declared significantly different out of the total number of peaks in that mass segment is shown in the fifth column of each mass segment in Table 1.
Figure 4
Figure 4
Duplicate proteomic profiles (technical replicates) of 5 biological samples in the study. In the left hand panel the first technical replicate is shown with the black solid line and the second technical replicate with the red dotted line and in the right hand panel the second technical replicate is shown with the black solid line and the first technical replicate with the red dotted line. The axes are equivalent in each plot and the mass axes apply to all plots.
Figure 5
Figure 5
Selected QC tool output for section of study of patients with different levels of renal function using CM10 ProteinChips. Panel (A) is similar to Figure 1 panel (C). Panel (B) shows the mean spectra obtained from samples in the reference set and also individual spectra which appear to be on the edge of the PC space in the PC plots in panel (A).
Figure 6
Figure 6
Variance components, mean and CV spectra for proteomic profiling study of renal function using IMAC-Cu chips). Each bar in the top panel represents the proportion of variance that can be attributed to biological (within and between classes) and technical (within and between days) components of variation for each peak. The peak corresponding to each bar is denoted by a gray line from the mean/CV spectra in the lower panel.

References

    1. Munro NP, Cairns DA, Clarke P, Rogers M, Stanley AJ, Barrett JH, Harnden P, Thompson D, Eardley I, Banks RE, Knowles MA. Urinary biomarker profiling in transitional cell carcinoma. International Journal of Cancer. 2006;119:2642–2650. doi: 10.1002/ijc.22238. - DOI - PubMed
    1. Ricolleau G, Charbonnel C, Lode L, Loussouarn D, Joalland MP, Bogumil R, Jourdain S, Minvielle S, Campone M, Deporte-Fety R, Campion L, Jezequel P. Surface-enhanced laser desorption/ionization time of flight mass spectrometry protein profiling identifies ubiquitin and ferritin light chain as prognostic biomarkers in node-negative breast cancer tumors. Proteomics. 2006;6:1963–1975. doi: 10.1002/pmic.200500283. - DOI - PubMed
    1. Taguchi F, Solomon B, Gregorc V, Roder H, Gray R, Kasahara K, Nishio M, Brahmer J, Spreafico A, Ludovini V, Massion PP, Dziadziuszko R, Schiller J, Grigorieva J, Tsypin M, Hunsucker SW, Caprioli R, Duncan MW, Hirsch FR, Bunn PA, Carbone DP. Mass spectrometry to classify non-small-cell lung cancer patients for clinical outcome after treatment with epidermal growth factor receptor tyrosine kinase inhibitors: A multicohort cross-institutional study. Journal of the National Cancer Institute. 2007;99:838–846. doi: 10.1093/jnci/djk195. - DOI - PubMed
    1. Yanagisawa K, Shyr Y, Xu BJ, Massion PP, Larsen PH, White BC, Roberts JR, Edgerton M, Gonzalez A, Nadaf S, Moore JH, Caprioli RM, Carbone DP. Proteomic patterns of tumour subsets in non-small-cell lung cancer. Lancet. 2003;362:433–439. doi: 10.1016/S0140-6736(03)14068-8. - DOI - PubMed
    1. Diamandis EP. Serum proteomic profiling by matrix-assisted laser desorption-ionization time-of-flight mass spectrometry for cancer diagnosis: next steps. Cancer Res. 2006;66:5540–5541. doi: 10.1158/0008-5472.CAN-05-4503. - DOI - PubMed

Publication types

MeSH terms