. 2009 Feb 21;256(4):655-62.
doi: 10.1016/j.jtbi.2008.10.025. Epub 2008 Nov 8.

Exploring the role of the immune response in preventing antibiotic resistance

Affiliations

Exploring the role of the immune response in preventing antibiotic resistance

Andreas Handel et al. J Theor Biol. .

Abstract

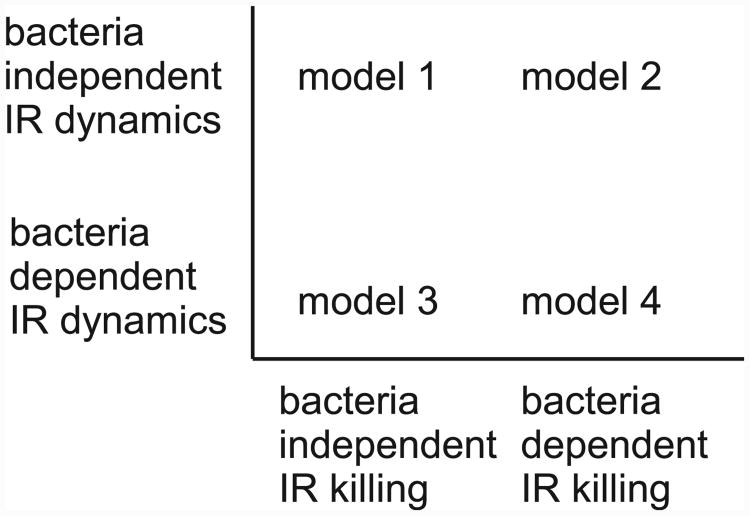
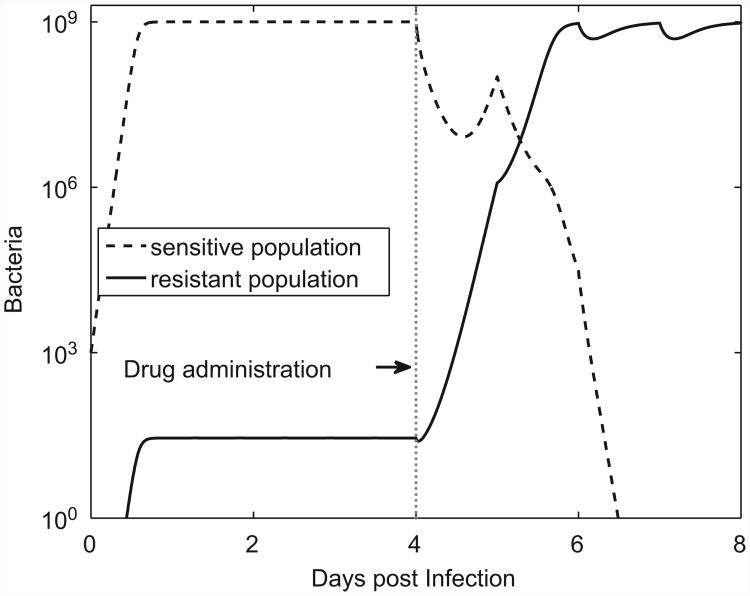
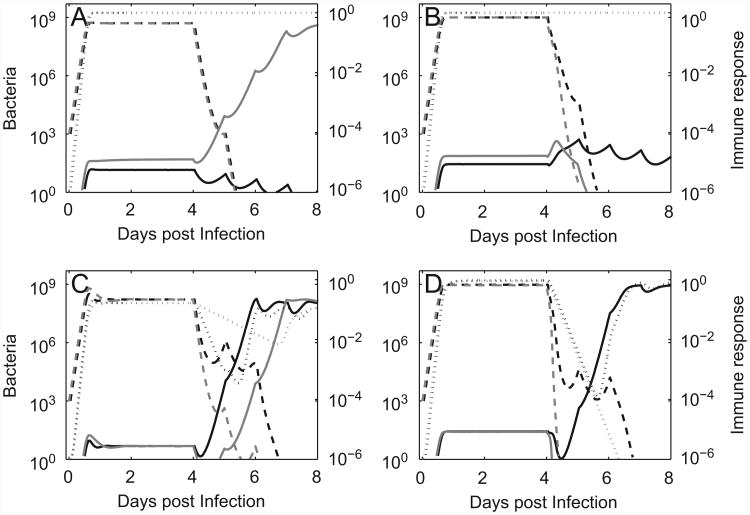
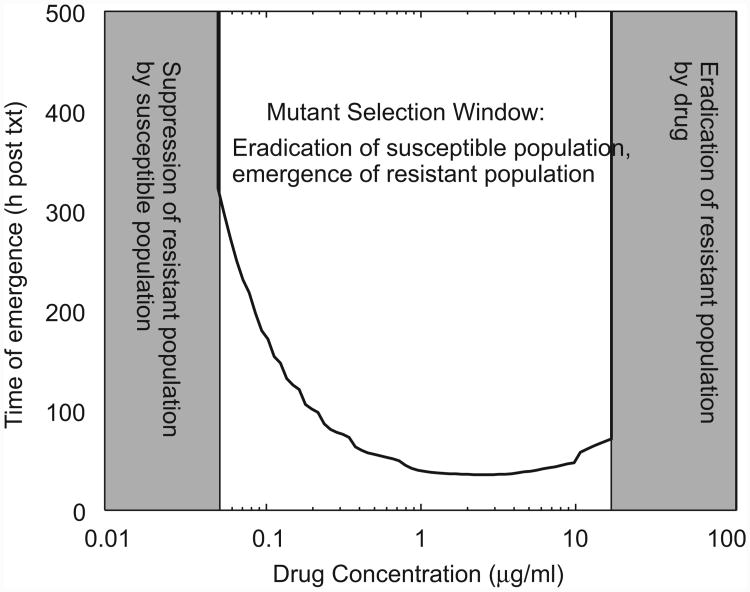
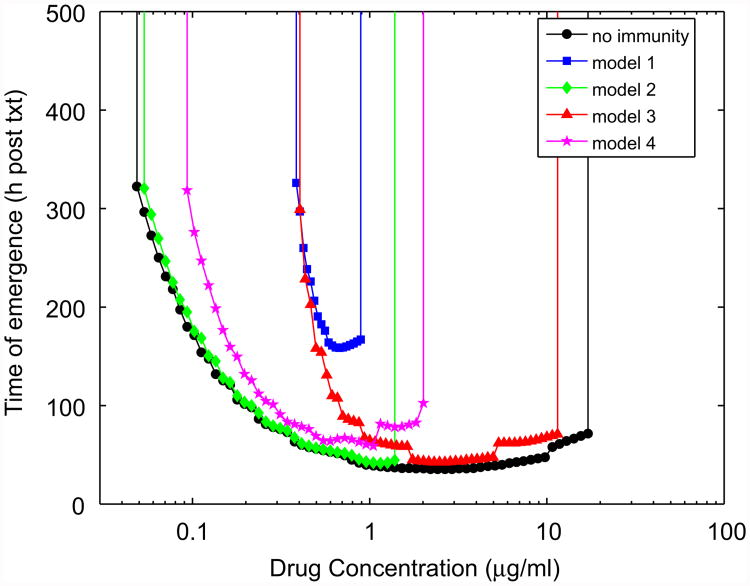
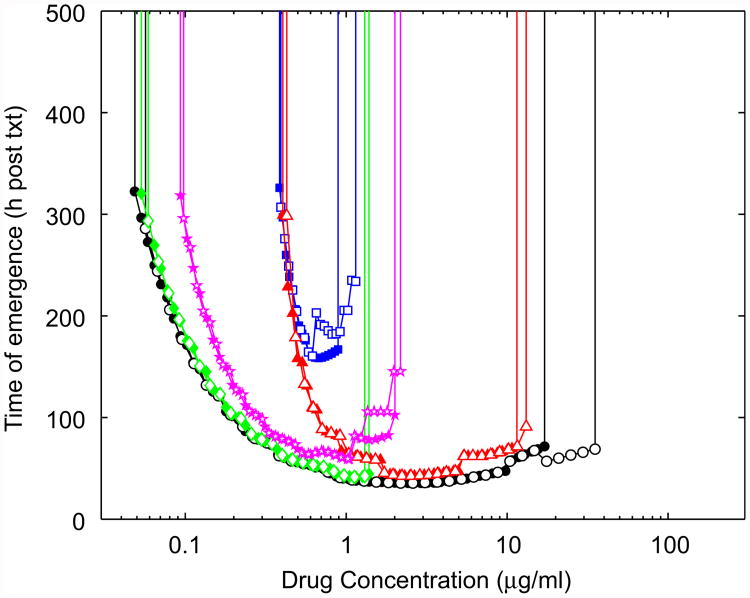
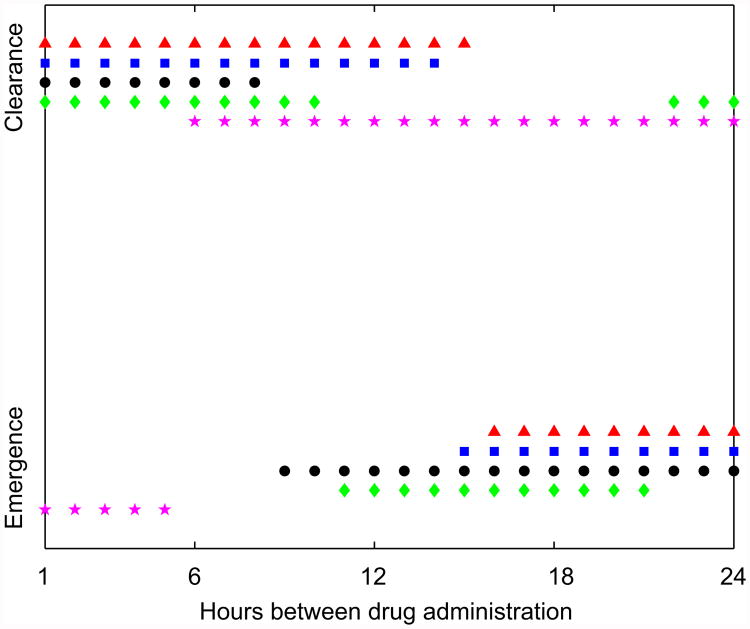
For many bacterial infections, drug resistant mutants are likely present by the time antibiotic treatment starts. Nevertheless, such infections are often successfully cleared. It is commonly assumed that this is due to the combined action of drug and immune response, the latter facilitating clearance of the resistant population. However, most studies of drug resistance emergence during antibiotic treatment focus almost exclusively on the dynamics of bacteria and the drug and neglect the contribution of immune defenses. Here, we develop and analyze several mathematical models that explicitly include an immune response. We consider different types of immune responses and investigate how each impacts the emergence of resistance. We show that an immune response that retains its strength despite a strong drug-induced decline of bacteria numbers considerably reduces the emergence of resistance, narrows the mutant selection window, and mitigates the effects of non-adherence to treatment. Additionally, we show that compared to an immune response that kills bacteria at a constant rate, one that trades reduced killing at high bacterial load for increased killing at low bacterial load is sometimes preferable. We discuss the predictions and hypotheses derived from this study and how they can be tested experimentally.


Figures

Fig. 1
Fig. 1
Graphical representation of the differences between the four models. IR: immune response.
Fig. 2
Fig. 2
Dynamics of infection in the absence of an immune response. Antimicrobial treatment is started at day 4. Every T = 24 h, a dose of C0 = 4μg/ml is administered. Parameters as given in Table 1.
Fig. 3
Fig. 3
Dynamics of infection in the presence of immune responses. Dotted lines show immune response (with axis label on the right side), solid and dashed lines show the drug resistant and drug sensitive bacteria. Drug dosing as described in legend of Fig. 2. The parameters b, gr, di, gi are all given in units of h−1. All parameter values are as given in Table 1 unless otherwise stated. (A) Model 1. Black: low-fitness (growth rate) resistant strain (gr = 0.65), prevention of resistance. Gray: high-fitness resistant strain (gr = 0.9), resistance emerges (killing rate b = 0.5). (B) Model 2. Black: maximum killing at low bacterial load is the same as in model 1, killing rate declines once the bacteria increase beyond 1% of the carrying capacity and is about one-hundredth that of model 1 for NN0 (s = N0/100, b = 0.5s, gr = 0.65). Gray: maximum killing at low bacterial load is twice that of model 1 but still only one-fiftieth that of model 1 for NN0 (s = N0/100, b = s, gr = 0.9). (C) Model 3. Black: the immune response changes rapidly as bacterial load changes (b = 5, di = 0.25, gi = di/N0). Gray: the immune response changes less rapidly as bacterial load changes (b = 5, di = 0.05, gi = di/N0). (D) Model 4. Black: maximum killing at low bacterial is the same as in model 3, killing rate declines once the bacteria increase beyond 1% of the maximum carrying capacity and is about one-hundredth that of model 3 for NN0 (s = N0/100, b = 5s, di = 0.25, gi = di/N0). Gray: maximum killing at low bacterial load is twice that of model 1 but still only one-fiftieth that of model 1 for NN0 (s = N0/100, b = 10s, di = 0.25, gi = di/N0).
Fig. 4
Fig. 4
The mutant selection window (MSW) in the absence of an immune response. Shown is the time of resistance emergence following treatment (txt), as a function of drug concentration (C0). Emergence is defined as the resistant population reaching 10% of the carrying capacity. The simulation is run until 14 days (txt) post-treatment start. If the resistant population has not reached 10% by day 14, the time of emergence is set to infinity. At low drug concentrations, the drug sensitive population is not removed and the resistant population cannot emerge. Very high drug doses kill both sensitive and resistant populations. Intermediate drug doses clear the sensitive population only, and thereby allow the resistant population to reach high levels.
Fig. 5
Fig. 5
The MSW in the presence of the different immune responses. Time to emergence is defined as described in the caption for Fig. 4. Immune responses are chosen as in Fig. 2 with gr = 0.65, b = 0.5 (model 1), s = N0/100 and b = s (model 2), b = 5, di = 0.25, gi = di/N0 (model 3), and s = N0/100, b = 10s, di = 0.25, gi = di/N0 (model 4).
Fig. 6
Fig. 6
The mutant selection window for imperfect adherence (empty markers). For comparison, results for complete adherence are replotted from Fig. 5 (solid markers). Everything else as described for Fig. 5.
Fig. 7
Fig. 7
Bacteria clearance or resistance emergence as a function of dosing regime. Drug is administered at the indicated time intervals, in doses such that the total amount of drug administered over one day, Ĉ, remains fixed. Ĉ for the situation without immunity and the four immune response models are 10, 0.75, 1.5, 8 and 2.5 μg/ml (see text). Everything else as described for Fig. 5.

References

    1. Ambrose PG, Bhavnani SM, Rubino CM, Louie A, Gumbo T, Forrest A, Drusano GL. Pharmacokinetics–pharmacodynamics of antimicrobial therapy: it's not just for mice anymore. Clin Infect Dis. 2007;44(1):79–86. URL 〈 http://dx.doi.org/10.1086/510079〉. - DOI - PubMed
    1. Andes D, Craig WA. Animal model pharmacokinetics and pharmacody-namics: a critical review. Int J Antimicrob Agents. 2002;19(4):261–268. - PubMed
    1. Antia R, Bergstrom CT, Pilyugin SS, Kaech SM, Ahmed R. Models of CD8+ responses: 1. What is the antigen-independent proliferation program. J Theor Biol. 2003;221(4):585–598. - PubMed
    1. Austin DJ, White NJ, Anderson RM. The dynamics of drug action on the within-host population growth of infectious agents: melding pharmacokinetics with pathogen population dynamics. J Theor Biol. 1998;194(3):313–339. URL 〈 http://dx.doi.org/10.1006/jtbi.1997.0438〉. - DOI - PubMed
    1. Bajenoff M, Wurtz O, Guerder S. Repeated antigen exposure is necessary for the differentiation, but not the initial proliferation, of naive CD4(+) T cells. J Immunol. 2002;168(4):1723–1729. - PubMed

Publication types

Substances