

Fifteen-year longitudinal trends in walking patterns and their impact on weight change
- PMID: 19056560
- PMCID: PMC2715291
- DOI: 10.3945/ajcn.2008.26147
Fifteen-year longitudinal trends in walking patterns and their impact on weight change
Abstract
Background: Although walking is the most popular leisure-time activity for adults, few long-term, longitudinal studies have examined the association between walking, an affordable and accessible form of physical activity, and weight gain.
Objective: The objective was to evaluate the association between changes in leisure-time walking and weight gain over a 15-y period.
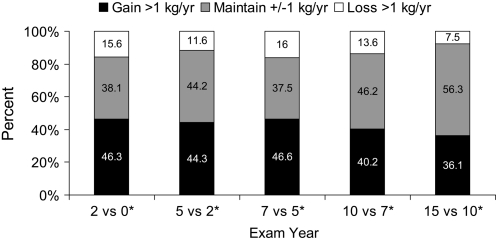
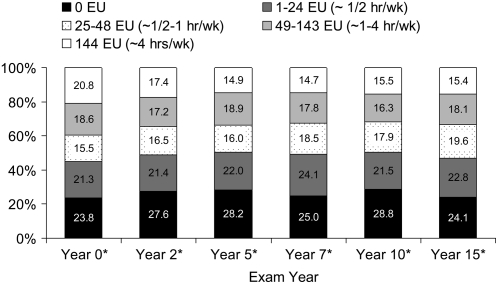
Design: Prospective data from the Coronary Artery Risk Development in Young Adults (CARDIA) Study of 4,995 men and women aged 18-30 y at baseline (1985-1986) from 4 US cities and reexamined 2, 5, 7, 10, and 15 y later. Sex-stratified, repeated-measures, conditional regression modeling with data from all 6 examination periods (n = 23,633 observations) was used to examine associations between walking and annualized 15-y weight change, with control for 15-y nonwalking physical activity, baseline weight (and their interaction), marital status, education, smoking, calorie intake, and baseline age, race, and field center.
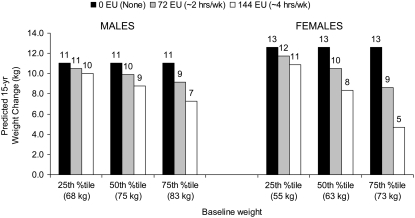
Results: Mean (+/- SE) baseline weights were 77.0 +/- 0.3 kg (men) and 66.2 +/- 0.3 kg (women), weight gain was approximately 1 kg/y, and the mean duration of walking at baseline was <15 min/d. After accounting for nonwalking physical activity, calorie intake, and other covariates, we found a substantial association between walking and annualized weight change; the greatest association was for those with a larger baseline weight. For example, for women at the 75th percentile of baseline weight, 0.5 h of walking/d was associated with 8 kg less weight gain over 15 y compared with women with no leisure time walking.
Conclusion: Walking throughout adulthood may attenuate the long-term weight gain that occurs in most adults.
Figures
Comment in
-
Further evidence for the benefits of walking.Am J Clin Nutr. 2009 Jan;89(1):15-6. doi: 10.3945/ajcn.2008.27118. Epub 2008 Dec 3. Am J Clin Nutr. 2009. PMID: 19056565 No abstract available.
References
-
- US Department of Health and Human Services Physical activity and health: a report of the Surgeon General. Atlanta, GA: Centers for Disease Control and Prevention, National Center for Chronic Disease Prevention and Health Promotion, 1996
-
- US Department of Health and Human Services Healthy people 2010: understanding and improving health. 2nd ed Washington, DC: US Government Printing Office, 2000
-
- Sidney S, Jacobs D, Haskell W, et al. Comparison of two methods of assessing physical activity in the Coronary Artery Risk Development in Young Adults (CARDIA) Study. Am J Epidemiol 1991;133:1231–45 - PubMed
-
- Simpson ME, Serdula M, Galuska DA, et al. Walking trends among U.S. adults: the Behavioral Risk Factor Surveillance System, 1987–2000. Am J Prev Med 2003;25:95–100 - PubMed
Publication types
MeSH terms
Grants and funding
- N01 HC048047/HC/NHLBI NIH HHS/United States
- N01-HC-48047/HC/NHLBI NIH HHS/United States
- N01-HC-95095/HC/NHLBI NIH HHS/United States
- R01-AA12162/AA/NIAAA NIH HHS/United States
- N01-HC-48049/HC/NHLBI NIH HHS/United States
- R01 AA012162/AA/NIAAA NIH HHS/United States
- R01 CA109831/CA/NCI NIH HHS/United States
- N01-HC-48047-48050/HC/NHLBI NIH HHS/United States
- N01-HC-48048/HC/NHLBI NIH HHS/United States
- K01-HD044263/HD/NICHD NIH HHS/United States
- P30-ES10126/ES/NIEHS NIH HHS/United States
- P30 ES010126/ES/NIEHS NIH HHS/United States
- N01-HC-05187/HC/NHLBI NIH HHS/United States
- N01 HC048050/HC/NHLBI NIH HHS/United States
- R01 CA121152/CA/NCI NIH HHS/United States
- N01 HC048048/HC/NHLBI NIH HHS/United States
- R01-CA12115/CA/NCI NIH HHS/United States
- N01-HC-48050/HC/NHLBI NIH HHS/United States
- N01 HC095095/HC/NHLBI NIH HHS/United States
- N01 HC048049/HC/NHLBI NIH HHS/United States
- DK56350/DK/NIDDK NIH HHS/United States
- K01 HD044263/HD/NICHD NIH HHS/United States
- P30 DK056350/DK/NIDDK NIH HHS/United States
LinkOut - more resources
Full Text Sources
Medical
