. 2009 Feb;55(2):274-84.
doi: 10.1373/clinchem.2008.115857. Epub 2008 Dec 4.

Adeno-associated virus-mediated human C-reactive protein gene delivery causes endothelial dysfunction and hypertension in rats

Affiliations

Adeno-associated virus-mediated human C-reactive protein gene delivery causes endothelial dysfunction and hypertension in rats

Hongjing Guan et al. Clin Chem. 2009 Feb.

Abstract

Background: Prospective studies have shown that C-reactive protein (CRP) is a predictor of hypertension. Because of confounding variables, a causal linkage between CRP and hypertension has not been clearly shown. We investigated whether high circulating concentrations of human CRP can induce hypertension in rats.

Methods: We administered a single intravenous injection of adeno-associated virus-green fluorescent protein (AAV-GFP) or AAV-hCRP and measured blood pressure. Using ELISA, we measured serum hCRP, serum endothelin 1 (ET-1), and urine cGMP, and we measured serum nitric oxide (NO) using the Griess method. We recorded heart rate, maximum pressure, arterial elastance, mean aortic pressure, cardiac output, and maximum rate of rise in left ventricular pressure (dP/dt max).

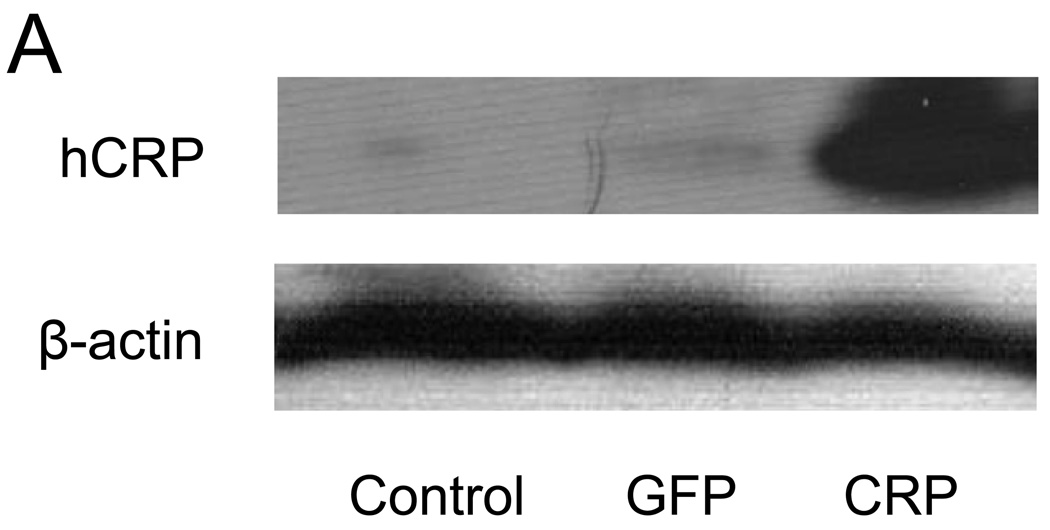
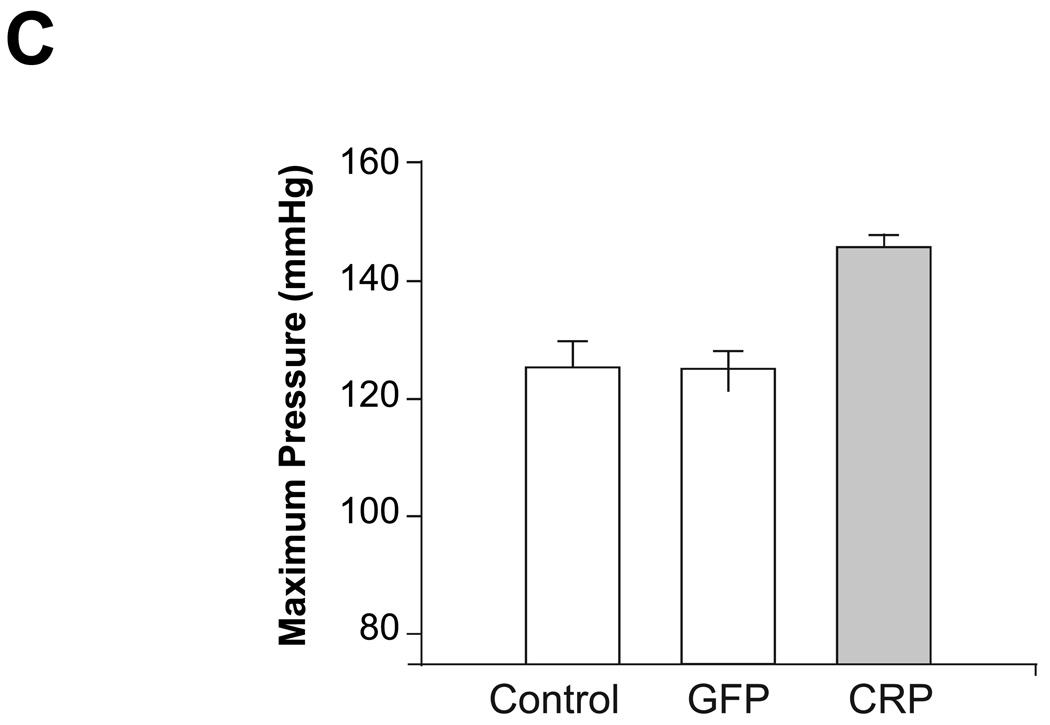
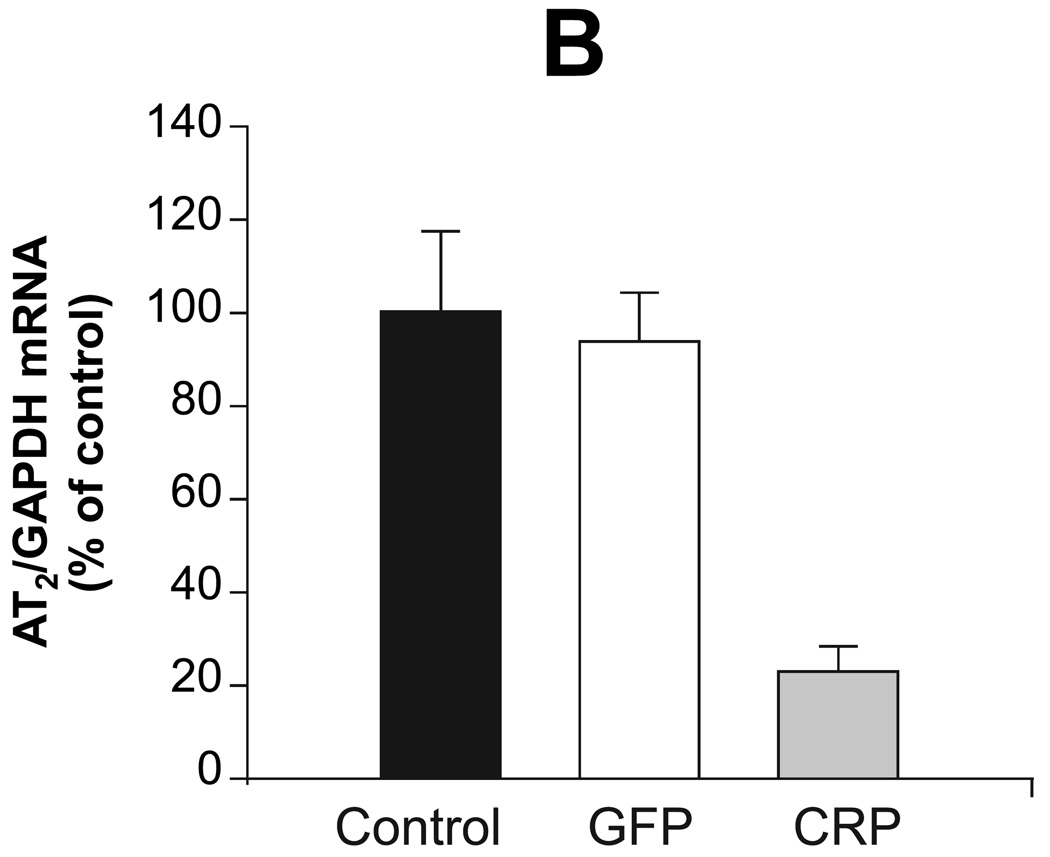
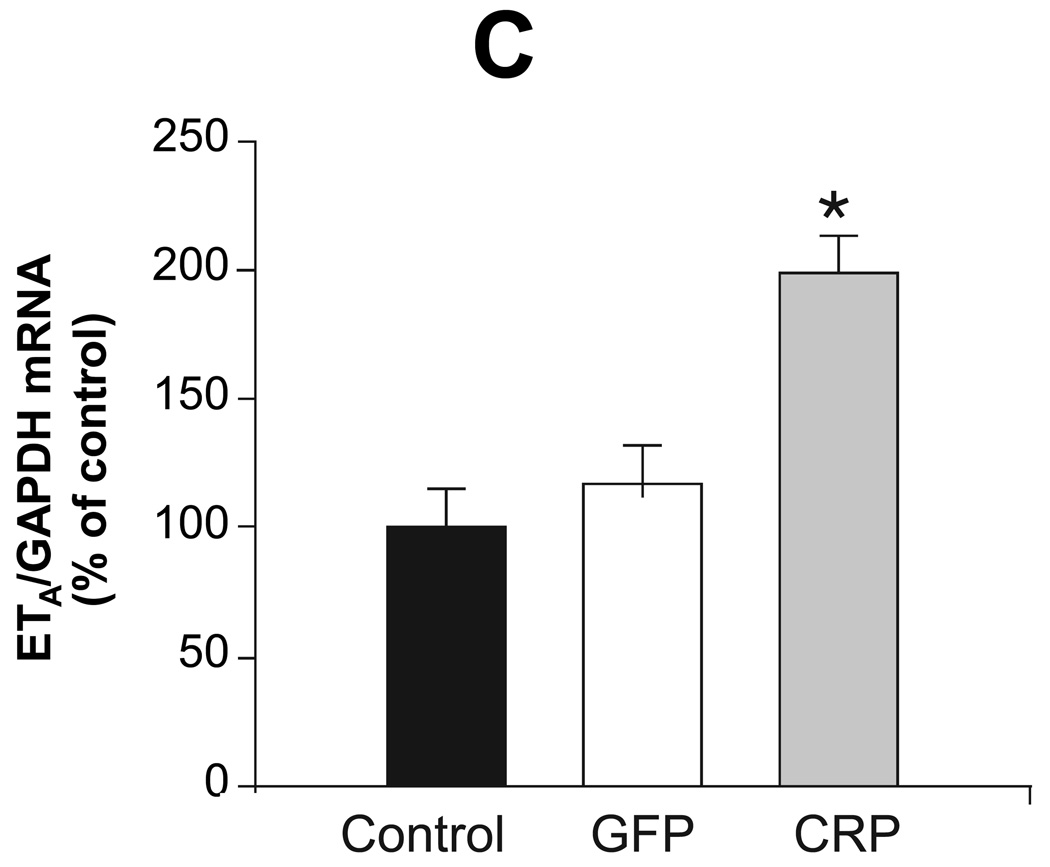
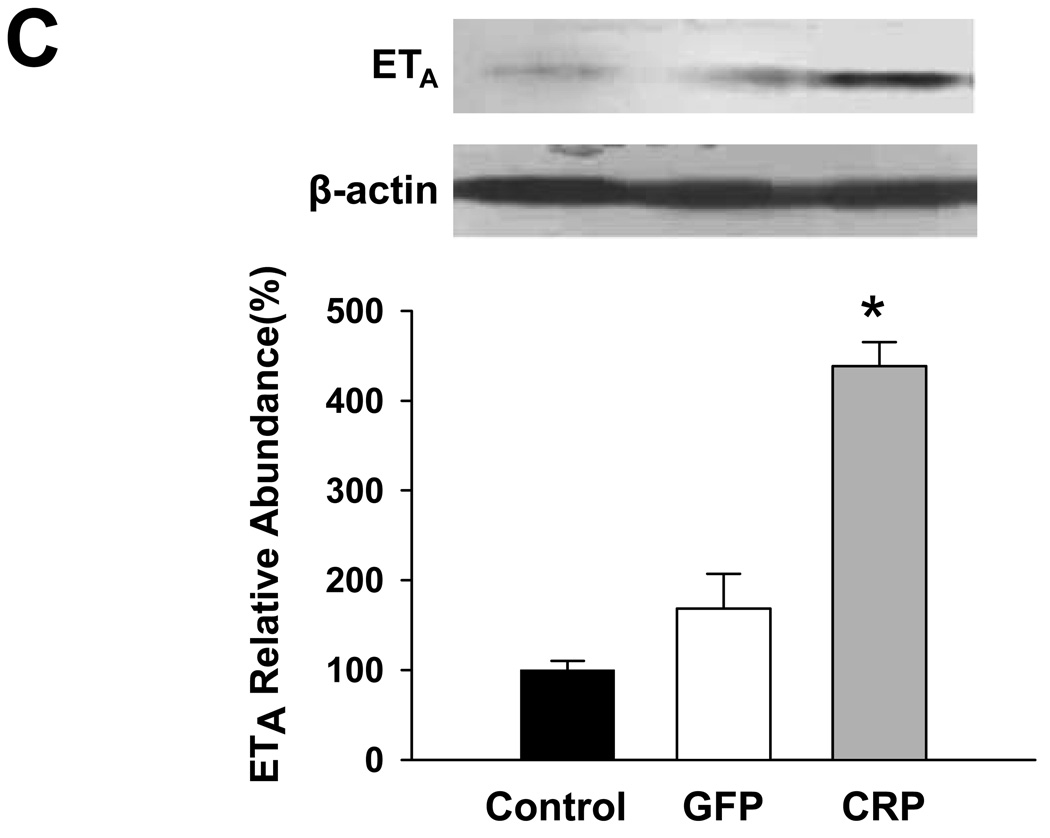
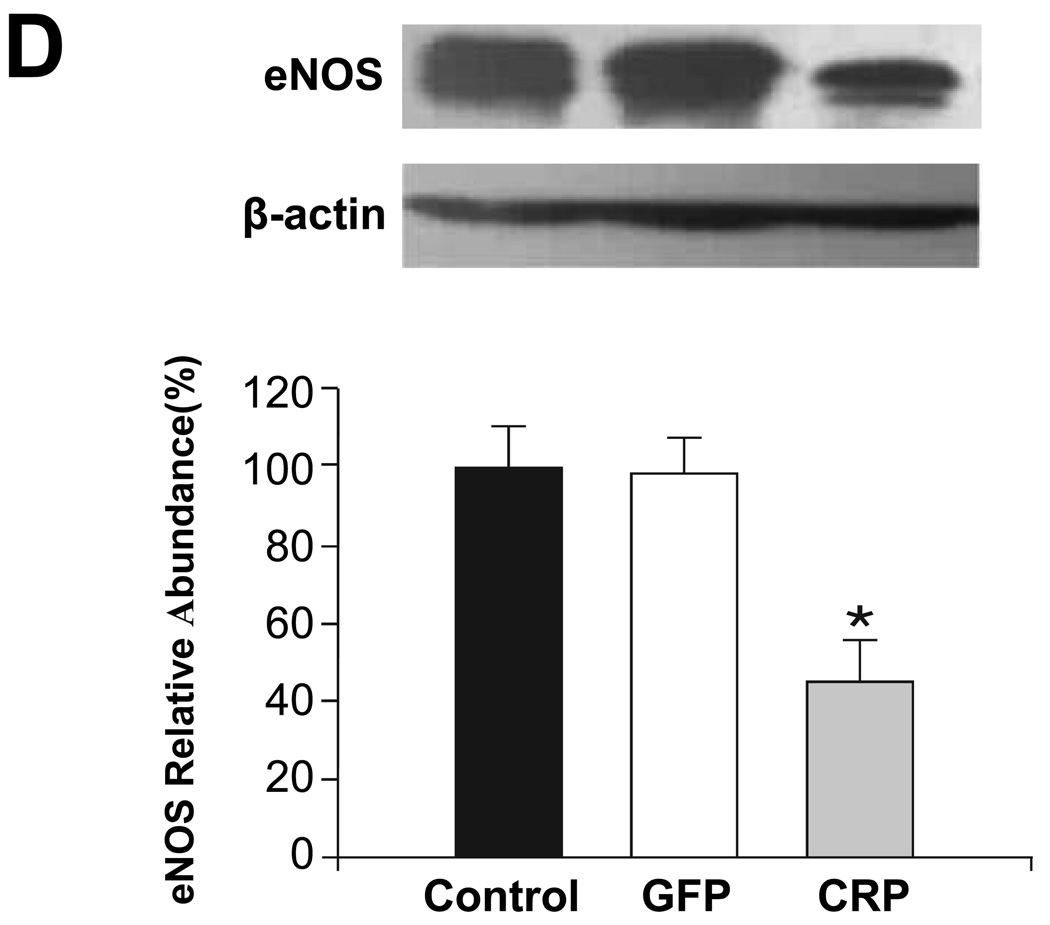
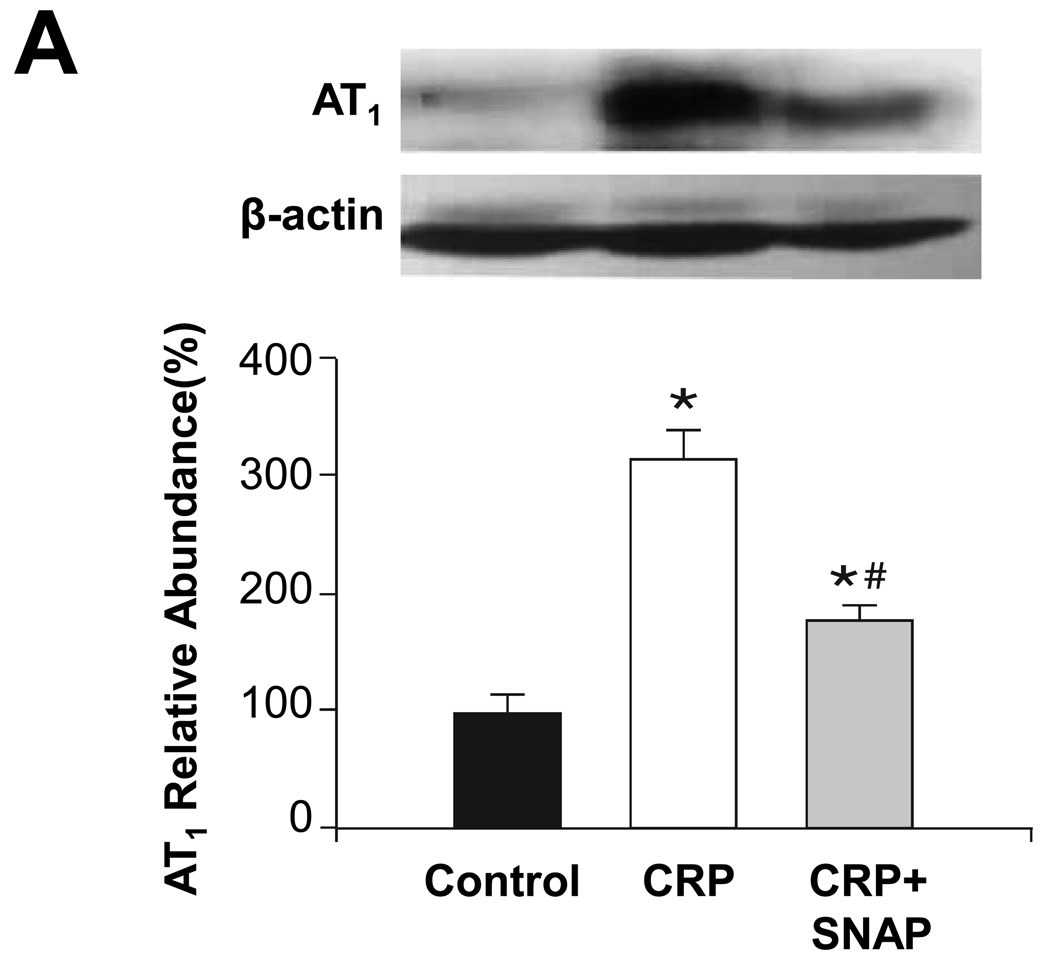
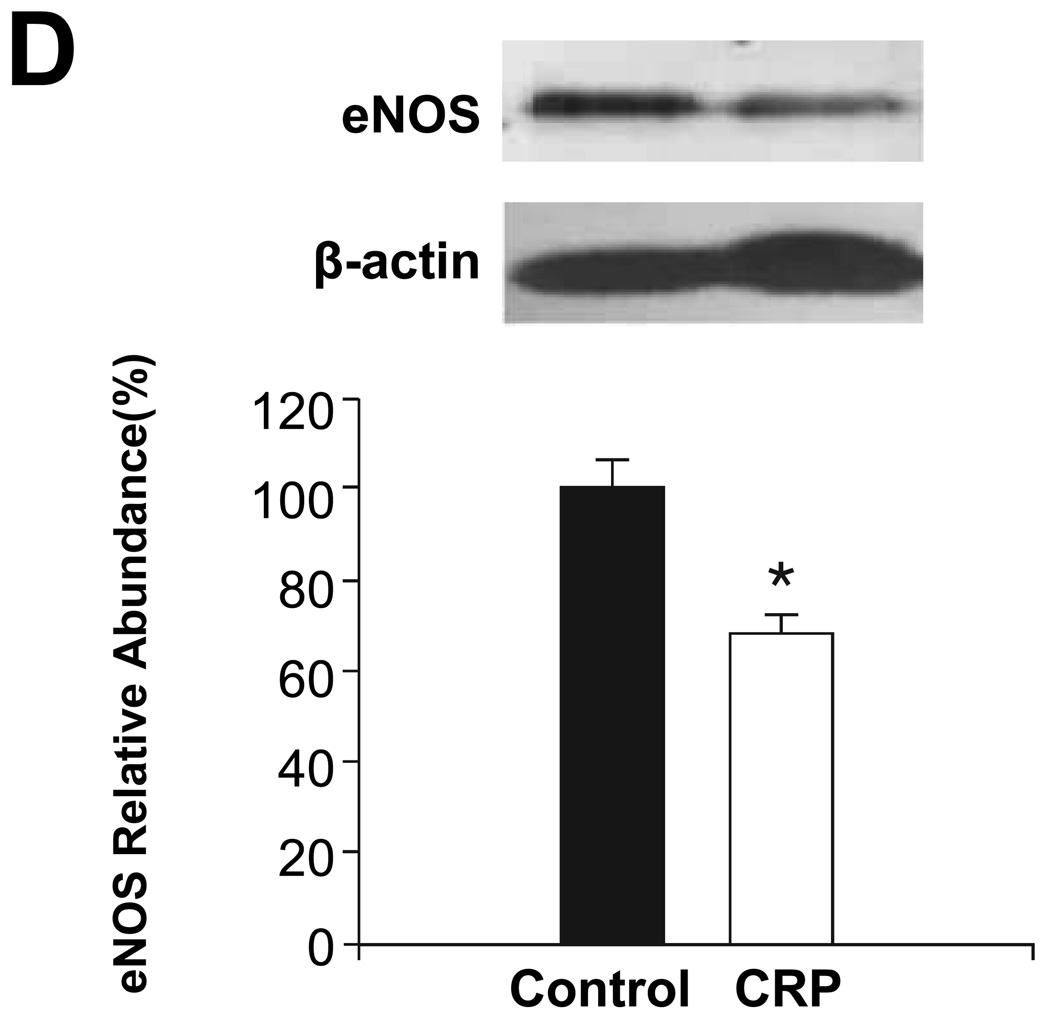
Results: A single injection of AAV-hCRP resulted in efficient and sustained hCRP expression and led to increased blood pressure 2 months after gene transfer that persisted for another 2 months. This effect was associated with decreased NO production, as demonstrated by decreased serum NO concentration and urinary cGMP excretion, and impairment of endothelial-dependent vascular relaxation. CRP transduction also increased expression of angiotensin type 1 receptor, ET-1, and endothelin type A receptor, decreased expression of angiotensin type 2 receptor and endothelial NO synthase in thoracic aortas, and increased arterial stiffness. Ex vivo studies indicated a similar detrimental effect of CRP that was reversed by the NO donor.

Conclusion: AAV vector-mediated CRP expression resulted in hypertension mediated through reduced NO production and subsequent alteration in ET-1 and renin-angiotensin system activation. Impaired arterial elasticity may also contribute to CRP-induced hypertension. These results support a causal role for CRP in the pathogenesis of hypertension.


Figures

Figure 1
Figure 1
AAV-mediated expression of hCRP. (A) Representative western blot analysis of hCRP expression in liver 4 months after gene delivery. (B) Serum concentrations of hCRP 2 and 4 months after gene delivery. (C) Real-time PCR results of hCRP mRNA expression. Data represent mean ± SD of 3–6 rats/group. ND = not detected.
Figure 1
Figure 1
AAV-mediated expression of hCRP. (A) Representative western blot analysis of hCRP expression in liver 4 months after gene delivery. (B) Serum concentrations of hCRP 2 and 4 months after gene delivery. (C) Real-time PCR results of hCRP mRNA expression. Data represent mean ± SD of 3–6 rats/group. ND = not detected.
Figure 2
Figure 2
CRP caused hypertension in rats. (A) Systolic blood pressure was monitored from the beginning of the study using the tail-cuff method. Rats injected with AAV-hCRP had significantly increased blood pressure beginning 2 months after gene delivery (P =0.000). Hemodynamic parameters were increased by CRP gene transfer. (B) CRP gene delivery increased mean aortic pressure (P =0.001). (C) CRP gene delivery increased maximum left ventricular pressure (P =0.004). (D) CRP gene delivery increased arterial elastance (P =0.000). Data represent mean ± SEM of 6 to 8 rats/group. * P < 0.05 vs. control group.
Figure 2
Figure 2
CRP caused hypertension in rats. (A) Systolic blood pressure was monitored from the beginning of the study using the tail-cuff method. Rats injected with AAV-hCRP had significantly increased blood pressure beginning 2 months after gene delivery (P =0.000). Hemodynamic parameters were increased by CRP gene transfer. (B) CRP gene delivery increased mean aortic pressure (P =0.001). (C) CRP gene delivery increased maximum left ventricular pressure (P =0.004). (D) CRP gene delivery increased arterial elastance (P =0.000). Data represent mean ± SEM of 6 to 8 rats/group. * P < 0.05 vs. control group.
Figure 3
Figure 3
NO biosynthesis was decreased by CRP gene delivery. (A) Endothelial-dependent relaxation to acetylcholine in aortic segments was impaired by CRP gene transfer. (B) CRP gene delivery decreased serum NO concentration. (C) CRP gene delivery decreased urine cGMP excretion. Data are presented as the mean ± SEM of 6 to 8 rats/group. * P < 0.05 vs. control group.
Figure 3
Figure 3
NO biosynthesis was decreased by CRP gene delivery. (A) Endothelial-dependent relaxation to acetylcholine in aortic segments was impaired by CRP gene transfer. (B) CRP gene delivery decreased serum NO concentration. (C) CRP gene delivery decreased urine cGMP excretion. Data are presented as the mean ± SEM of 6 to 8 rats/group. * P < 0.05 vs. control group.
Figure 4
Figure 4
Effects of CRP gene transfer on mRNA concentrations in aortic tissue 4 months after gene delivery. Aortic mRNA concentrations of (A) AT1, (B) AT2, (C) ETA, (D) eNOS and (E) ET-1 are shown. Data are represented as the mean ± SEM of five independent experiments relative to GAPDH mRNA levels. * P < 0.05 vs. control group.
Figure 4
Figure 4
Effects of CRP gene transfer on mRNA concentrations in aortic tissue 4 months after gene delivery. Aortic mRNA concentrations of (A) AT1, (B) AT2, (C) ETA, (D) eNOS and (E) ET-1 are shown. Data are represented as the mean ± SEM of five independent experiments relative to GAPDH mRNA levels. * P < 0.05 vs. control group.
Figure 5
Figure 5
Effects of CRP gene transfer on protein expression in aortic tissue 4 months after gene delivery. Aortic protein concentrations of (A) AT1, (B) AT2, (C) ETA and (D) eNOS (E) are shown. The upper portion is a representative western blot of the protein of interest while the lower graph is of the mean densitometric data of protein values normalized to β-actin. (E) Serum ET-1 concentrations as measured by ELISA. Data are presented as the mean ± SEM of three independent experiments. * P < 0.05 vs. control group.(AT1: P=0.000, AT2: P=0.000, ETA: P=0.000, eNOS: P=0.009, ET-1: P=0.001)
Figure 5
Figure 5
Effects of CRP gene transfer on protein expression in aortic tissue 4 months after gene delivery. Aortic protein concentrations of (A) AT1, (B) AT2, (C) ETA and (D) eNOS (E) are shown. The upper portion is a representative western blot of the protein of interest while the lower graph is of the mean densitometric data of protein values normalized to β-actin. (E) Serum ET-1 concentrations as measured by ELISA. Data are presented as the mean ± SEM of three independent experiments. * P < 0.05 vs. control group.(AT1: P=0.000, AT2: P=0.000, ETA: P=0.000, eNOS: P=0.009, ET-1: P=0.001)
Figure 6
Figure 6
Effect of in vitro treatment with CRP on protein or mRNA concentrations in aortic tissues. Aortic segments excised from 2 month old rats were treated with CRP (50 mg/l) and SNAP (100 mg/l) as indicated for 6 hours. Protein concentrations of (A) AT1, (B) AT2, (C) ETA and (D) eNOS are shown. The upper portion is a representative western blot of the protein of interest, while the lower graph is of the mean densitometric data of protein values normalized to β-actin. (E) ET-1 mRNA values are shown normalized to GAPDH. Data are presented as the mean ± SEM of three independent experiments. * P < 0.05 vs. control group; # P < 0.05 vs. CRP group. (AT1: * P=0.002, #P=0.023 AT2: * P=0.000, #P=0.002 ETA: * P=0.003, #P=0.039 eNOS: * P=0.02, ET-1: * P=0.016, #P=0.003)
Figure 6
Figure 6
Effect of in vitro treatment with CRP on protein or mRNA concentrations in aortic tissues. Aortic segments excised from 2 month old rats were treated with CRP (50 mg/l) and SNAP (100 mg/l) as indicated for 6 hours. Protein concentrations of (A) AT1, (B) AT2, (C) ETA and (D) eNOS are shown. The upper portion is a representative western blot of the protein of interest, while the lower graph is of the mean densitometric data of protein values normalized to β-actin. (E) ET-1 mRNA values are shown normalized to GAPDH. Data are presented as the mean ± SEM of three independent experiments. * P < 0.05 vs. control group; # P < 0.05 vs. CRP group. (AT1: * P=0.002, #P=0.023 AT2: * P=0.000, #P=0.002 ETA: * P=0.003, #P=0.039 eNOS: * P=0.02, ET-1: * P=0.016, #P=0.003)

Comment in

References

    1. Chrysohoou C, Pitsavos C, Panagiotakos DB, Skoumas J, Stefanadis C. Association between prehypertension status and inflammatory markers related to atherosclerotic disease: The ATTICA Study. Am J Hypertens. 2004;17:568–573. - PubMed
    1. Lakoski SG, Cushman M, Palmas W, Blumenthal R, D'Agostino RB, Jr, Herrington DM. The relationship between blood pressure and C-reactive protein in the Multi-Ethnic Study of Atherosclerosis (MESA) J Am Coll Cardiol. 2005;46:1869–1874. - PubMed
    1. Ridker PM. Clinical application of C-reactive protein for cardiovascular disease detection and prevention. Circulation. 2003;107:363–369. - PubMed
    1. Sesso HD, Buring JE, Rifai N, Blake GJ, Gaziano JM, Ridker PM. C-reactive protein and the risk of developing hypertension. Jama. 2003;290:2945–2951. - PubMed
    1. Niskanen L, Laaksonen DE, Nyyssonen K, Punnonen K, Valkonen VP, Fuentes R, Tuomainen TP, Salonen R, Salonen JT. Inflammation, abdominal obesity, and smoking as predictors of hypertension. Hypertension. 2004;44:859–865. - PubMed

Publication types

MeSH terms