

Relative cerebral blood volume values to differentiate high-grade glioma recurrence from posttreatment radiation effect: direct correlation between image-guided tissue histopathology and localized dynamic susceptibility-weighted contrast-enhanced perfusion MR imaging measurements
- PMID: 19056837
- PMCID: PMC7051449
- DOI: 10.3174/ajnr.A1377
Relative cerebral blood volume values to differentiate high-grade glioma recurrence from posttreatment radiation effect: direct correlation between image-guided tissue histopathology and localized dynamic susceptibility-weighted contrast-enhanced perfusion MR imaging measurements
Abstract
Background and purpose: Differentiating tumor growth from posttreatment radiation effect (PTRE) remains a common problem in neuro-oncology practice. To our knowledge, useful threshold relative cerebral blood volume (rCBV) values that accurately distinguish the 2 entities do not exist. Our prospective study uses image-guided neuronavigation during surgical resection of MR imaging lesions to correlate directly specimen histopathology with localized dynamic susceptibility-weighted contrast-enhanced perfusion MR imaging (DSC) measurements and to establish accurate rCBV threshold values, which differentiate PTRE from tumor recurrence.
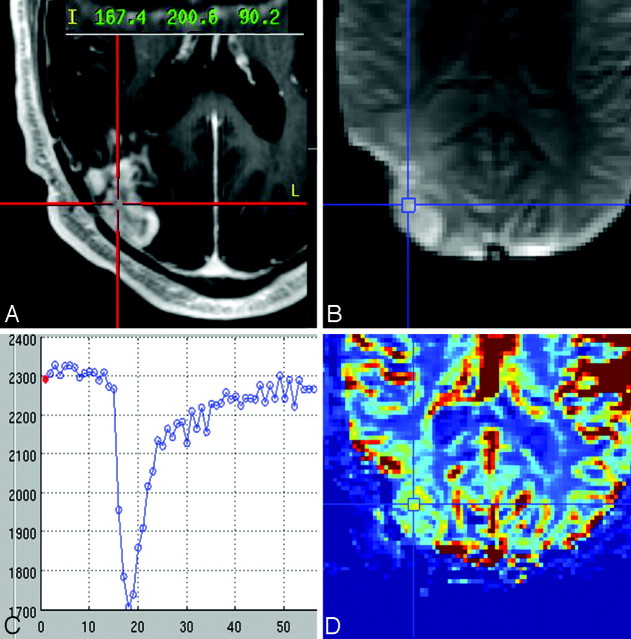
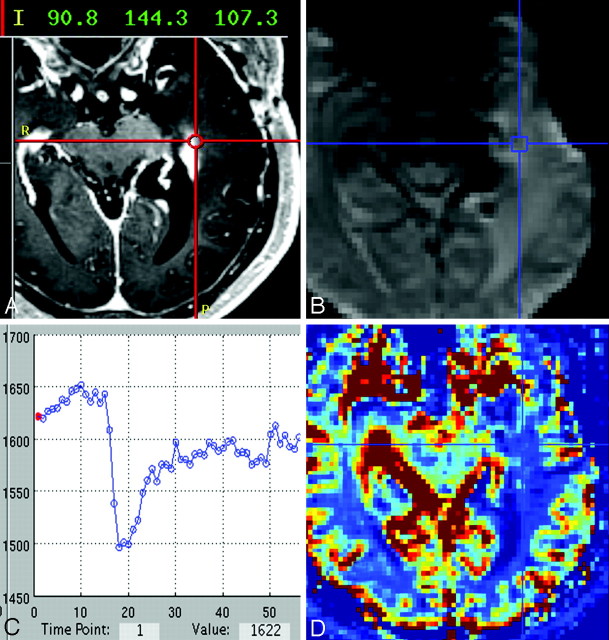
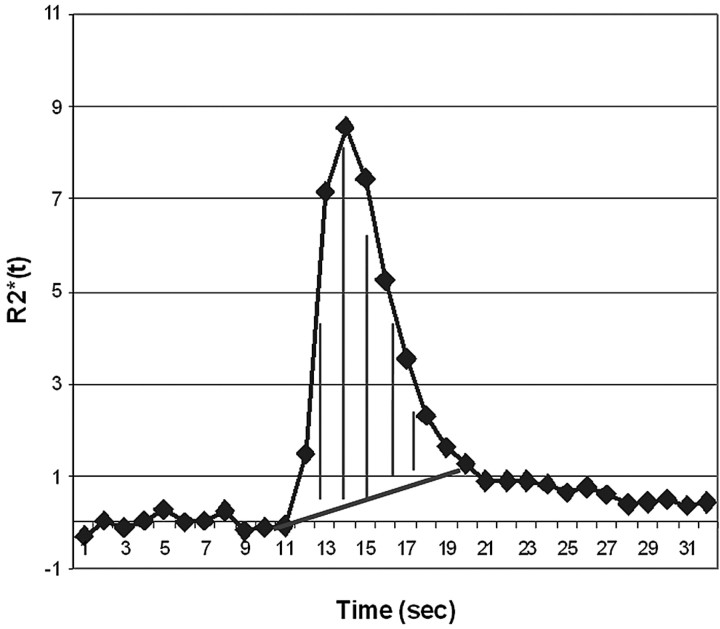
Materials and methods: Preoperative 3T gradient-echo DSC and contrast-enhanced stereotactic T1-weighted images were obtained in patients with high-grade glioma (HGG) previously treated with multimodality therapy. Intraoperative neuronavigation documented the stereotactic location of multiple tissue specimens taken randomly from the periphery of enhancing MR imaging lesions. Coregistration of DSC and stereotactic images enabled calculation of localized rCBV within the previously recorded specimen locations. All tissue specimens were histopathologically categorized as tumor or PTRE and were correlated with corresponding rCBV values. All rCBV values were T1-weighted leakage-corrected with preload contrast-bolus administration and T2/T2*-weighted leakage-corrected with baseline subtraction integration.
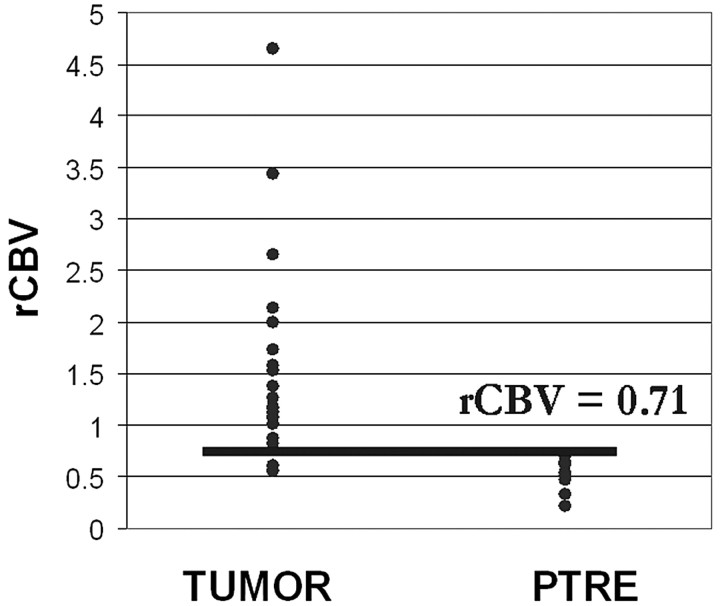
Results: Forty tissue specimens were collected from 13 subjects. The PTRE group (n = 16) rCBV values ranged from 0.21 to 0.71, tumor (n = 24) values ranged from 0.55 to 4.64, and 8.3% of tumor rCBV values fell within the PTRE group range. A threshold value of 0.71 optimized differentiation of the histopathologic groups with a sensitivity of 91.7% and a specificity of 100%.
Conclusions: rCBV measurements obtained by using DSC and the protocol we have described can differentiate HGG recurrence from PTRE with a high degree of accuracy.
Figures
References
-
- Kumar AJ, Leeds NE, Fuller GN, et al. Malignant gliomas: MR imaging spectrum of radiation therapy- and chemotherapy-induced necrosis of the brain after treatment. Radiology 2000;217:377–84 - PubMed
-
- Rosen BR, Belliveau JW, Vevea JM, et al. Perfusion imaging with NMR contrast agents. Magn Reson Med 1990;14:249–65 - PubMed
-
- Weisskoff RM, Belliveau J, Kwong K, et al. Functional MR imaging of capillary hemodynamics. In: Potchen EJ, Jaacke EM, Siebert JE, et al, eds. Magnetic Resonance Angiography: Concepts and Applications. St. Louis: CV Mosby;1992. :473–84
-
- Remler MP, Marcussen WH, Tiller-Borsich J. The late effects of radiation on the blood brain barrier. Int J Radiat Oncol Biol Phys 1986;12:1965–69 - PubMed
Publication types
MeSH terms
LinkOut - more resources
Full Text Sources
Other Literature Sources
Medical