. 2008 Dec 1;22(23):3268-81.
doi: 10.1101/gad.1725808.

Modular control of endothelial sheet migration

Affiliations

Modular control of endothelial sheet migration

Philip Vitorino et al. Genes Dev. .

Abstract

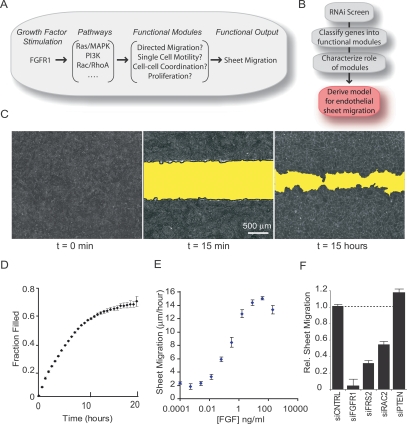
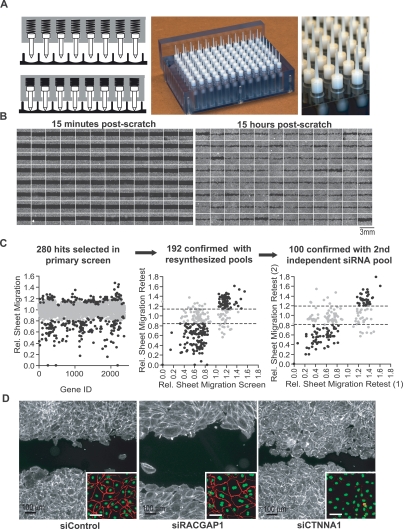
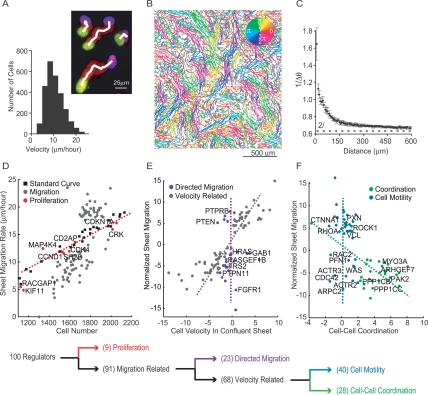
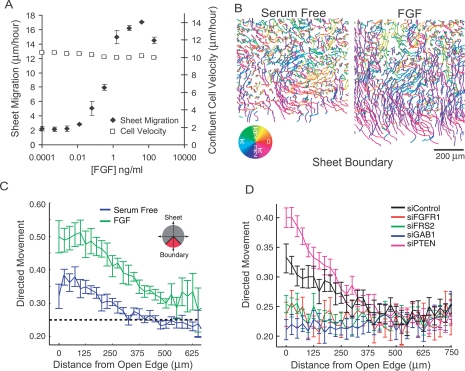
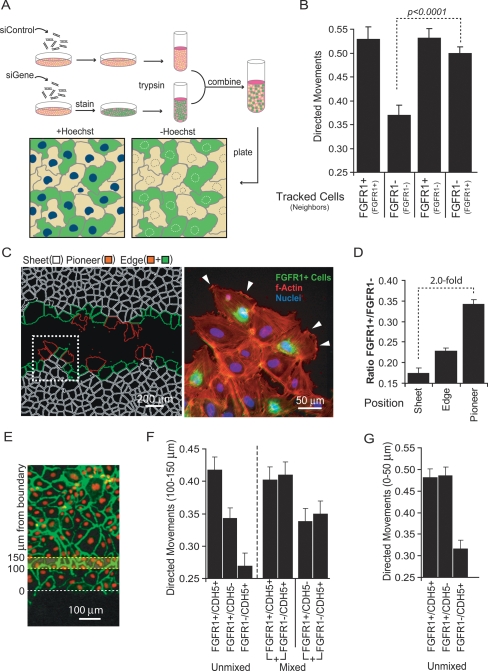
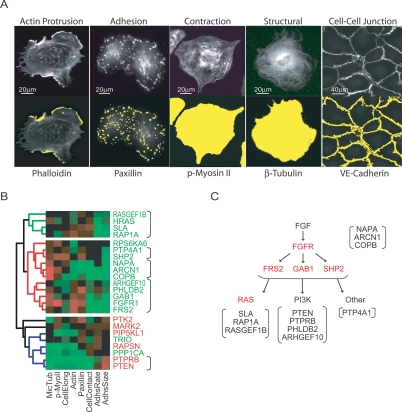
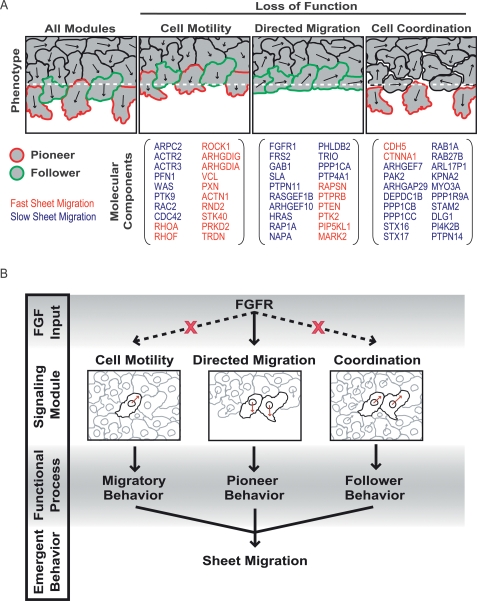
Growth factor-induced migration of endothelial cell monolayers enables embryonic development, wound healing, and angiogenesis. Although collective migration is widespread and therapeutically relevant, the underlying mechanism by which cell monolayers respond to growth factor, sense directional signals, induce motility, and coordinate individual cell movements is only partially understood. Here we used RNAi to identify 100 regulatory proteins that enhance or suppress endothelial sheet migration into cell-free space. We measured multiple live-cell migration parameters for all siRNA perturbations and found that each targeted protein primarily regulates one of four functional outputs: cell motility, directed migration, cell-cell coordination, or cell density. We demonstrate that cell motility regulators drive random, growth factor-independent motility in the presence or absence of open space. In contrast, directed migration regulators selectively transduce growth factor signals to direct cells along the monolayer boundary toward open space. Lastly, we found that regulators of cell-cell coordination are growth factor-independent and reorient randomly migrating cells inside the sheet when boundary cells begin to migrate. Thus, cells transition from random to collective migration through a modular control system, whereby growth factor signals convert boundary cells into pioneers, while cells inside the monolayer reorient and follow pioneers through growth factor-independent migration and cell-cell coordination.


Figures

Figure 1.
Figure 1.
FGF-induced sheet migration in HUVEC endothelial cells. (A) Schematic view of how growth factor-induced signaling pathways may regulate functional modules to produce sheet migration. (B) Experimental workflow for investigating sheet migration. (C) Fluorescent microscopy images of confluent HUVEC cells stained with AlexaFluor594-conjugated wheat germ agglutinin before (left panel) and 15 min after (middle panel) cell removal. (Right panel) After 15 h in the presence of serum, cells were fixed and stained with fluorescein phalloidin. (D) Kinetic analysis of sheet migration was performed by continuous imaging of fluorescently stained monolayers over 20 h (n = 4). (E) Sheet migration rates for HUVEC monolayers treated with varying concentrations of FGF (n = 4). (F) Sheet migration rates for cells transfected with siRNA pools targeting predicted positive (FGFR1, FRS2, and RAC2) and negative (PTEN) regulators of sheet migration (n = 4). Values were normalized against cells transfected with control siRNA. Standard error bars are shown.
Figure 2.
Figure 2.
Design, implementation, and validation of a 96-well formatted assay for sheet migration. (A) High throughput scratch tool with 96 individual spring loaded tips capable of generating uniform cell-free bands in a multiwell format. (Left panel) Diagrams of spring loaded tips with and without applied pressure. (Middle and right panels) Photographs of the scratch unit and the tips, respectively. (B) Montages of 96 images from a multiwell plate where each well was transfected with a different pool of siRNA. Fluorescent images were taken 15 min (left panel) and 15 h (right panel) after cell removal. (C) Results from siRNA screens targeting 2400 human signaling proteins. (Left panel) Sheet migration rates (gray dots) are the mean of duplicates and normalized to plate medians. A subset of genes (black dots) was selected for retest based on their deviation from median. (Middle panel) As a control, pools of siRNAs were resynthesized and retested. (Right panel) As a second control, repeating hits (black dots) were again selected and a second, independent siRNA pool was synthesized against the same targets and retested. One-hundred hits that showed consistent deviations in all experiments were considered confirmed hits. For both retest experiments, sheet migration rates were normalized to cells transfected with control siRNA, and each retest experiment was performed at least four times. (D) Examples of siRNA effects on sheet migration. Cells transfected with control, RACGAP1 and CTNNA1 siRNAs, were stained with fluorescein-phalloidin (main image) and VE-cadherin (inset).
Figure 3.
Figure 3.
Sequential decision tree analysis to functionally cluster siRNA perturbations. (A) A series of superimposed images of migrating cells with the initial position in yellow, final position in blue, and intermediate positions in red (nuclear marker). The white line marks the output of the tracking algorithm. The histogram illustrates the distribution of individual cell velocities within the sheet. (B) Cell tracks from an intact monolayer imaged every 20 min for 16 h and colored according to the direction of movement. (C) Quantification of coordinated cell movement. The graph shows the inverted, angular difference between cell pairs as a function of distance between the pairs (five repeats; error bars represent standard error). The dashed line at 2/π represents the threshold for random movement. (D) Effect of cell density on sheet migration. White squares show migration rates measured for control cells plated at different densities. The red dashed line represents the best linear fit to these control measurements (r-squared = 0.97). Sheet migration rates are plotted as a function of cell number for validated hits (n = 4; gray and red dots). Gene perturbations that lie within two standard deviations of the control line were considered density-dependent and marked as red dots. (E) Remaining siRNA targets were tested for a possible role in directed cell migration. Sheet migration rate is plotted as a function of average individual cell velocity within an unperturbed monolayer for each migration-related siRNA perturbation (normalized values). The gray line approximates the correlation axis between cell velocity and sheet migration. Velocity-independent regulators, whose effect on single cell velocity was within two standard deviations of control values, are shown in purple (directed migration module). (F) Remaining velocity-related siRNA knockdowns were classified into cell–cell coordination and cell motility modules. Sheet migration rates are plotted as a function of directional correlation. Genes that enhance or suppress directional correlation are marked in green (cell–cell coordination module), while genes that affect sheet migration but have weak effects on directional correlation, are marked in blue (cell motility module). The decision tree is summarized below the individual plots. All data points represent an average of at least four independent experiments.
Figure 4.
Figure 4.
Molecular basis for directed migration into cell-free space. (A) Dose response curve relating sheet migration (black diamonds) to individual cell velocities in an unperturbed sheet (white squares) in response to varying concentrations of FGF (n = 3, error bars represent standard error of the mean). (B) Representative cell tracks near an open edge for monolayers treated with FGF (right panel) or serum-free media (left panel) colored according to the direction of movement. (C) Quantification of traces in (B) where fraction of cell movements oriented toward cell-free space (directed migration) is calculated as a function of distance from the open edge in the presence (green) or absence (blue) of FGF. (D) Same as C where monolayers are tracked in the presence of FGF and transfected with siRNA targeting various FGF-related signaling genes previously classified as being part of the directed migration module.
Figure 5.
Figure 5.
Pioneer and follower behavior. (A) Schematic representation of coculture experiments to investigate pioneer and follower behavior (green and orange colored cells used for illustration). Cell marking was based on one population stained with CellTracker (InVitrogen) and both populations stained with Hoescht. (B) FGFR1+ cells induce polarized movement in neighboring FGFR1 cells. FGFR1+ or FGFR1 cells were cocultured 1:1 with FGFR1+ or FGFR1 cells (four combinations). Cells in contact with the sheet margin in one population were tracked and their orientation measured (tracked cells listed first and neighbors listed in parentheses). A random orientation is 0.25. (C, left panel) Example of an image depicting pioneer (red) versus nonpioneer (green) locations at the sheet margin (defined as more versus less than half of the circumference in contact with the open space). White cells depict internal sheet cells. Cell boundaries were based on nuclear and F-actin stains. (Right panel) Pioneer cells are often FGFR1+ and are rich in actin ruffles. Picture is a close-up of the white box shown in the left panel with phalloidin staining shown in red, Hoescht staining shown in blue, and FGFR1+ cells shown in green. Lamellipodial ruffling is highlight with white arrows. (D) FGFR+ cells are enriched in pioneer positions. Bar graph shows the ratio of FGFR1+/FGFR1 cells in pioneer, edge and sheet positions. Plating ratio was 0.2 between FGFR1+:FGFR1 cells. (E) Diagram illustrating the positions from which directed motility measurements were taken for the “follower” experiments in F and G. (F) Follower behavior is lost inside sheets lacking VE-cadherin. Directed motility of cells was measured 150 μm from the sheet margin under various coculture conditions. Unmixed experiments represent homogenous cultures receiving the indicated siRNA treatment. Mixed population experiments show the directed motility for each population within a cocultured experiment (plated at a 1:1 ratio) (G) Directed motility for cells positioned at the sheet margin in monolayers treated with combined gene and/or control knockdowns.
Figure 6.
Figure 6.
Subdivision of modules using structural and morphological characteristics. (A) All siRNAs were tested in secondary assays using molecular parameters expected to be important for sheet migration. Top panels show fluorescent images (20×) of markers. Bottom panels include the mask (in yellow, overlayed over an F-actin stain) generated by the image analysis software used to measure intensity and area of various cell structure. (B) Hierarchical clustering of directed motility genes using data from structural secondary assays. Fast and slow sheet migrators shown in red and green, respectively. (C) Pathway scheme of directed migration signaling components with their putative functional proximity to the FGFR according to their proximity in B. Identified upstream regulators are marked in red. Putative RAS-related genes, PI3K pathway components, and regulators of receptor transport are set apart with brackets.
Figure 7.
Figure 7.
Modular control of endothelial sheet migration. (A) Schematic representation of sheet migration defects when specific functional modules are disabled by protein knockdown. A number of genes from each module are listed as examples with fast and slow sheet migration indicated as red and blue lettering, respectively. (B) Coordination of sheet migration by an FGF-dependent directed migration module and a FGF-independent cell–cell coordination module.

References

    1. Adams C.L., Nelson W.J., Smith S.J. Quantitative analysis of cadherin-catenin-actin reorganization during development of cell–cell adhesion. J. Cell Biol. 1996;135:1899–1911. - PMC - PubMed
    1. Bikfalvi A., Klein S., Pintucci G., Rifkin D.B. Biological roles of fibroblast growth factor-2. Endocr. Rev. 1997;18:26–45. - PubMed
    1. Bindschadler M., McGrath J.L. Sheet migration by wounded monolayers as an emergent property of single-cell dynamics. J. Cell Sci. 2007;120:876–884. - PubMed
    1. Brandman O., Liou J., Park W.S., Meyer T. STIM2 is a feedback regulator that stabilizes basal cytosolic and endoplasmic reticulum Ca2+ levels. Cell. 2007;131:1327–1339. - PMC - PubMed
    1. Carmeliet P. Angiogenesis in health and disease. Nat. Med. 2003;9:653–660. - PubMed

Publication types

Substances

LinkOut - more resources