. 2008 Dec 1;22(23):3335-48.
doi: 10.1101/gad.490608.

NF1 loss disrupts Schwann cell-axonal interactions: a novel role for semaphorin 4F

Affiliations

NF1 loss disrupts Schwann cell-axonal interactions: a novel role for semaphorin 4F

Simona Parrinello et al. Genes Dev. .

Abstract

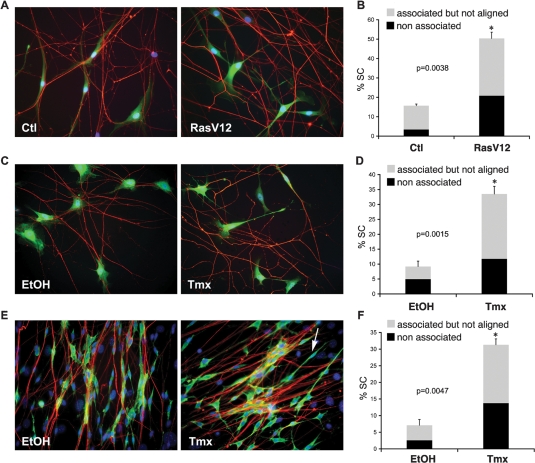
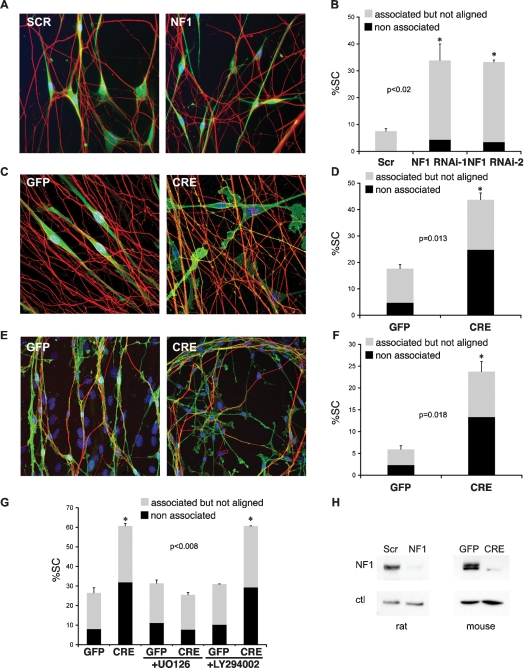
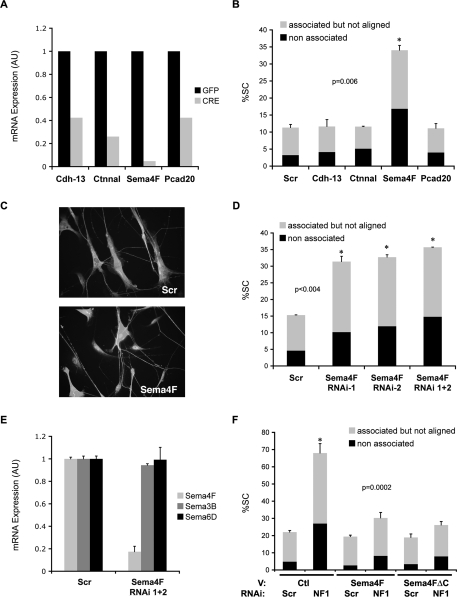
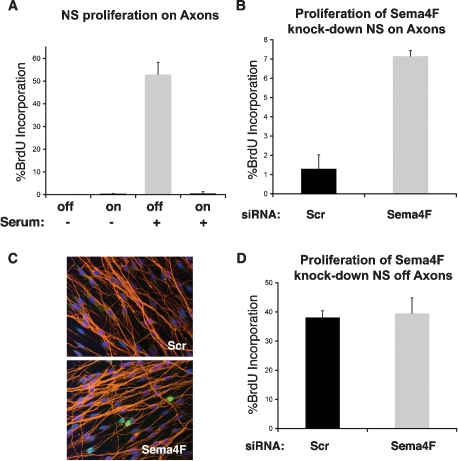
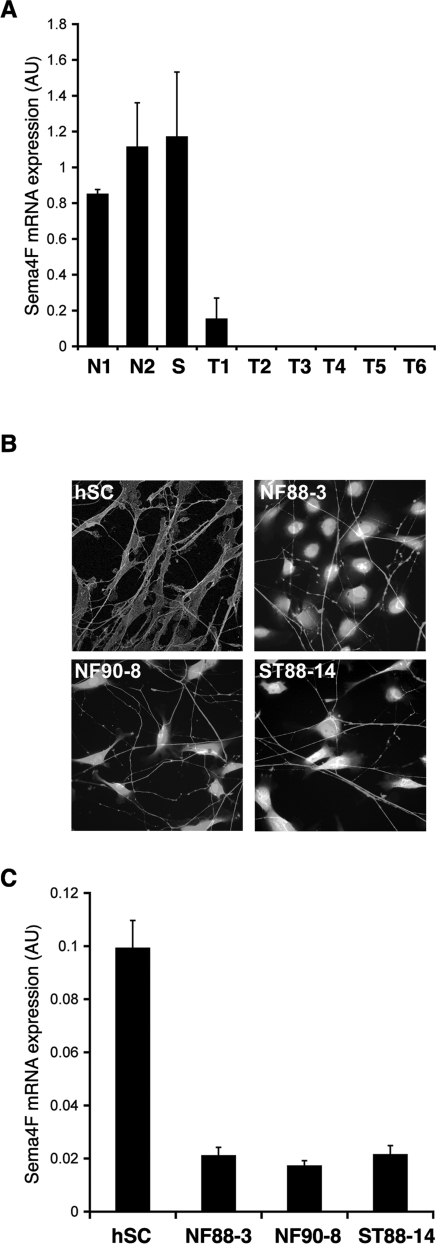
Neurofibromatosis type 1 (NF1) patients develop neurofibromas, tumors of Schwann cell origin, as a result of loss of the Ras-GAP neurofibromin. In normal nerves, Schwann cells are found tightly associated with axons, while loss of axonal contact is a frequent and important early event in neurofibroma development. However, the molecular basis of this physical interaction or how it is disrupted in cancer remains unclear. Here we show that loss of neurofibromin in Schwann cells is sufficient to disrupt Schwann cell/axonal interactions via up-regulation of the Ras/Raf/ERK signaling pathway. Importantly, we identify down-regulation of semaphorin 4F (Sema4F) as the molecular mechanism responsible for the Ras-mediated loss of interactions. In heterotypic cocultures, Sema4F knockdown induced Schwann cell proliferation by relieving axonal contact-inhibitory signals, providing a mechanism through which loss of axonal contact contributes to tumorigenesis. Importantly, Sema4F levels were strongly reduced in a panel of human neurofibromas, confirming the relevance of these findings to the human disease. This work identifies a novel role for the guidance-molecules semaphorins in the mediation of Schwann cell/axonal interactions, and provides a molecular mechanism by which heterotypic cell-cell contacts control cell proliferation and suppress tumorigenesis. Finally, it provides a new approach for the development of therapies for NF1.


Figures

Figure 1.
Figure 1.
Oncogenic Ras/Raf impairs Schwann cell–axonal interactions. (A–D) Primary rat DRG–Schwann cells association assays. (E,F) Primary rat DRG–Fibroblast–Schwann cell dissociation assay. (A) Immunofluorescence staining for neurofilament marker RT97 (red) and GFP (green) of NS-Ctl (Ctl) or NS-RasV12 (RasV12) infected Schwann cells. Nuclei are counterstained with Hoechst. (C,E) Immunofluorescence staining for RT97 (red) and Schwann cell marker S100 (green) of NSΔRafER cocultured with DRGs (C) or DRG and fibroblasts (E) in the presence of vehicle (EtOH) or tamoxifen (Tmx). Arrow in E indicates an example of a dissociated Schwann cell. (B,D,F) Quantification of Schwann cell–axonal interactions. Graphs show the percentage of Schwann cells in the cultures that fail to associate (black) or associate but do not align (gray) with axons. Data represent mean ± SE of duplicate cultures (n > 400 cells; asterisk indicates statistical significance and P values are shown). For each data set, a representative experiment of three independent repeats that gave similar results is shown.
Figure 2.
Figure 2.
NF1 loss impairs Schwann cell–axonal interactions through the Raf/ERK pathway. (A,B) Primary rat DRG–Schwann cells association assays. (C,D,G) Primary rat DRG–Nf1flox/flox mouse Schwann cell association assay. (E,F) Orthotypic Nf1flox/flox DRG–fibroblast–Schwann cell dissociation assay. (A) Immunofluorescence staining for RT97 (red) and Schwann cell marker S100 (green) of NS cells transfected with scrambled or one of two independent siRNA oligos to NF1 cocultured with DRGs. Nuclei are counterstained with Hoechst. (C,E) Immunofluorescence staining for Schwann cell marker p75NGFR (green) and RT97 (red) of Adeno-GFP-infected (GFP) or Adeno-Cre-infected (CRE) cultures. (B,D,F) Quantification of Schwann cell/axonal interactions. Shown is one representative experiment of three that gave similar results. Bars represent mean ± SE of duplicate cultures (n > 400 cells). Asterisk indicates statistical significance as shown by P value. (G) Quantification of DRG–Nf1 flox/flox Schwann cells association assays performed in the absence (left GFP and CRE bars) or presence (middle and right GFP and CRE bars) of specific inhibitors of Ras signaling (U0126 15 μM, LY294002 20 μM). (H) Western analysis of neurofibromin (NF1) knockdown in rat NS (left) and mouse NS cells (right).
Figure 3.
Figure 3.
Down-regulation of Semaphorin 4F mediates the disruption of Schwann cell/axonal interactions induced by loss of NF1. (A) Quantitative RT–PCR analysis of mRNA expression levels of indicated proteins in purified Nf1flox/flox Schwann cells infected with Adeno-GFP (GFP, dark gray bars) or Adeno-Cre (CRE, light gray bars). (B) Quantification of rat DRG–Schwann cells association assay. NS were transfected with scrambled siRNA sequences (Scr) or siRNA sequences to cadherin-13 (Cdh-13), α-catenin like 1 (Ctnnal), semaphorin 4F (Sema4F), and protocadherin 20 (Pcad20) and seeded onto DRGs. Only Sema4F siRNA disrupted axonal association. Shown is the mean ± SE of duplicate cultures. (n > 400 cells). Asterisk indicates statistical significance as shown by P value. Data are representative of one of three independent experiments with similar results. (C) Representative immunofluorescence staining of DRGs cocultured with NS cells transfected with scrambled (scr) or semaphorin 4F (Sema4F) siRNAs. Schwann cells are labeled with anti-S100 antibody and axons are labeled with anti-RT97 antibody. (D) Quantification of Schwann cell–axonal interactions in DRG association assays performed with NS cells transfected with siRNA to a scrambled (scr) or two independent semaphorin 4F sequences (Sema4F RNAi-1 and -2) or their combination (Sema4F RNAi 1 + 2). (E) Quantitative RT–PCR for Schwann cell-expressed semaphorins following transfection with scrambled (scr) or semaphorin 4F (Sema4F) siRNAs. (F) Quantification of Schwann cell/axonal interactions in DRG association assays performed with NS cells cotransfected with a GFP-encoding vector and either empty vector (Ctl) or Sema4F encoding vector and subsequently transfected with either Scr or NF1 siRNA oligos as indicated. Only GFP-positive cells were scored. Shown is the mean ± SE of triplicate cultures (n > 600 cells). Asterisks indicate statistical significance. Shown is one representative experiment of three that gave similar results.
Figure 4.
Figure 4.
Down-regulation of Semaphorin 4F results in Schwann cell proliferation. (A) BrdU incorporation of NS cells cocultured with DRGs. BrdU-positive cells in contact with axons (on) and at the periphery of the DRG with no axonal contact (off) were counted in the absence or presence of serum as indicated. Representative of three that gave similar results. Shown is the mean ± SE of triplicate coverslips. (B,D) BrdU incorporation of NS cells transfected with siRNAs to a scrambled (Scr, black) or semaphorin 4F sequence (Sema4F, gray). Upon serum stimulation, percentage of BrdU labeling of cells in contact with axons (B) and without axonal contact (D) was calculated. Representative experiment of three that gave similar results. Shown is the mean ± SE of triplicate coverslips. Shown are the results using the mixture of two siRNAs to Sema4F. Similar results were obtained with each siRNA individually. (C) Representative image of results quantified in B. (Red) axons; (green) BrdU incorporation; (blue) Hoechst.
Figure 5.
Figure 5.
Semaphorin 4F expression is down-regulated in human neurofibromas and MPNST-derived human tumor cell lines. (A,C) Quantitative RT–PCR analysis of semaphorin 4F expression normalized to GAPDH. (A) RNA levels in sections of normal human nerve tissue (N1, N2), human schwannoma (S), human dermal (T1, T2), and plexiform neurofibromas (T3–T6). (C) Expression in human Schwann cells (hSC) and three tumor cell lines (NF88-3, NF90-8, and ST88-14) of Schwann cell origin cultured under the same conditions. (B) Immunofluorescence staining for neurofilament marker RT97 and p75NGFR (hSC) or fluorescence of tumor cells prelabeled with a vital cell dye (NF88-3, NF90-8, and ST88-14).

References

    1. Bain J., Plater L., Elliott M., Shpiro N., Hastie C.J., McLauchlan H., Klevernic I., Arthur J.S., Alessi D.R., Cohen P. The selectivity of protein kinase inhibitors: A further update. Biochem. J. 2007;408:297–315. - PMC - PubMed
    1. Basu T.N., Gutmann D.H., Fletcher J.A., Glover T.W., Collins F.S., Downward J. Aberrant regulation of ras proteins in malignant tumour cells from type 1 neurofibromatosis patients. Nature. 1992;356:713–715. - PubMed
    1. Casazza A., Fazzari P., Tamagnone L. Semaphorin signals in cell adhesion and cell migration: Functional role and molecular mechanisms. Adv. Exp. Med. Biol. 2007;600:90–108. - PubMed
    1. Chan J.R., Jolicoeur C., Yamauchi J., Elliott J., Fawcett J.P., Ng B.K., Cayouette M. The polarity protein Par-3 directly interacts with p75NTR to regulate myelination. Science. 2006;314:832–836. - PubMed
    1. Cichowski K., Jacks T. NF1 tumor suppressor gene function: Narrowing the GAP. Cell. 2001;104:593–604. - PubMed

Publication types