. 2008 Nov 15;22(22):3172-83.
doi: 10.1101/gad.1706508.

Chromatin structure analyses identify miRNA promoters

Affiliations

Chromatin structure analyses identify miRNA promoters

Fatih Ozsolak et al. Genes Dev. .

Abstract

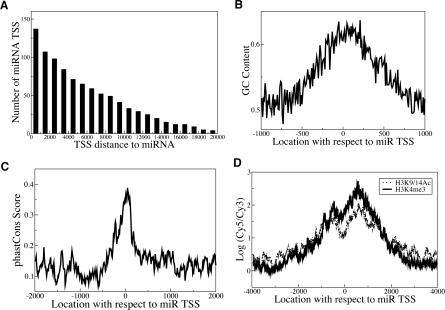
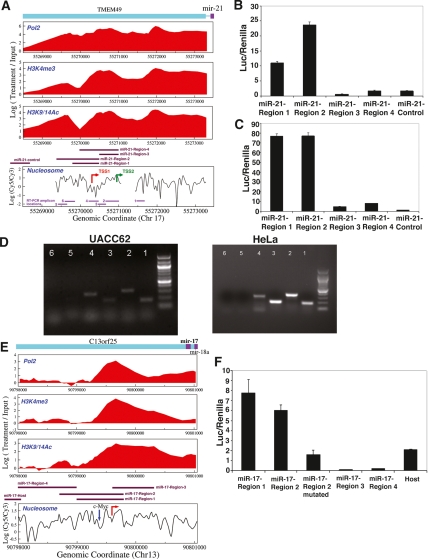
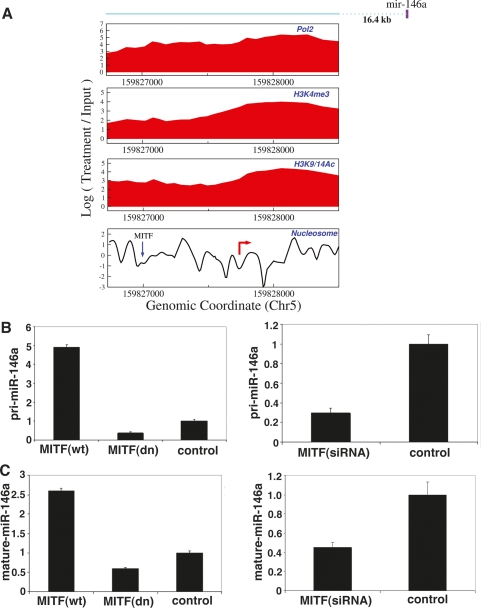
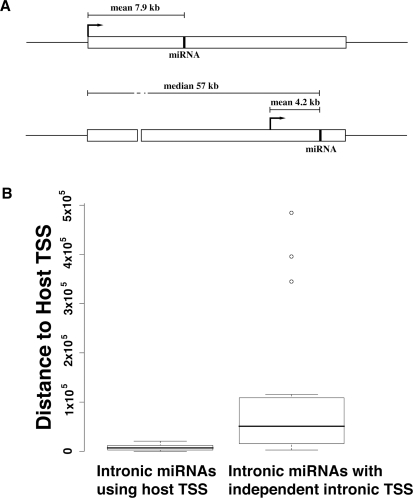
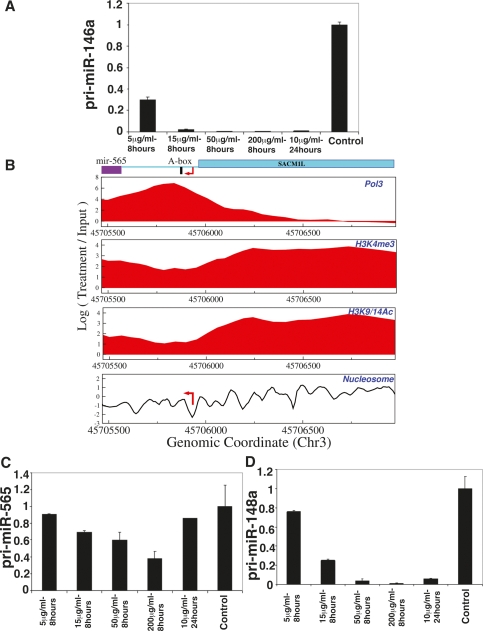
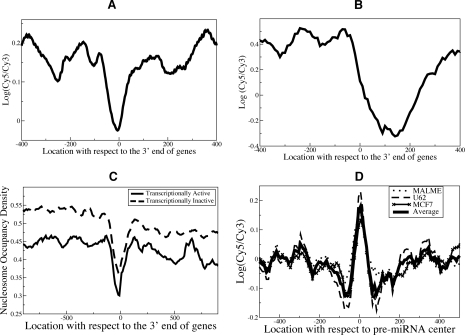
Although microRNAs (miRNAs) are key regulators of gene expression in normal human physiology and disease, transcriptional regulation of miRNAs is poorly understood, because most miRNA promoters have not yet been characterized. We identified the proximal promoters of 175 human miRNAs by combining nucleosome mapping with chromatin signatures for promoters. We observe that one-third of intronic miRNAs have transcription initiation regions independent from their host promoters and present a list of RNA polymerase II- and III-occupied miRNAs. Nucleosome mapping and linker sequence analyses in miRNA promoters permitted accurate prediction of transcription factors regulating miRNA expression, thus identifying nine miRNAs regulated by the MITF transcription factor/oncoprotein in melanoma cells. Furthermore, DNA sequences encoding mature miRNAs were found to be preferentially occupied by positioned-nucleosomes, and the 3' end sites of known genes exhibited nucleosome depletion. The high-throughput identification of miRNA promoter and enhancer regulatory elements sheds light on evolution of miRNA transcription and permits rapid identification of transcriptional networks of miRNAs.


Figures

Figure 1.
Figure 1.
miRNA promoters exhibit similarities to known RNAPII promoters. (A) Cumulative histogram showing miRNA promoter distances relative to the corresponding mature miRNA locations in the human genome. The Y-axis represents the number of miRNA promoters with promoter-to-mature miRNA distance greater than or equal to the indicated x-value. (B,C) Average GC content (B) and evolutionary conservation scores (Siepel et al. 2005) (C) are shown at miRNA promoters. The high GC content and evolutionary conservation near transcription initiation regions are similar to the characteristic features found in coding genes (Ozsolak et al. 2007). (D) Composite H3K4me3 and H3K9/14Ac profiles at novel miRNA TSS regions. The X-axis represents the distance relative to the transcription initiation region, the Y-axis the average H3K4me3 or H3K9/14Ac ChIP–chip signal of all miRNA promoters at the indicated x-value. The concentrated H3K4me3 and H3K9/14Ac modifications around transcription initiation regions are similar to the patterns observed for coding gene TSSs (Heintzman et al. 2007).
Figure 2.
Figure 2.
Identification of miR-21 and miR-17-cluster transcription initiation regions. (A) A nucleosome-depleted area (TSS1) 617 bp upstream of the published position (TSS2) may be the miR-21 TSS. (B,C) To identify regions with promoter function, several segments shown in A were cloned upstream of a luciferase reporter. miR-21-Region-1,2,3,4 and miR-21-control pGL3-basic luciferase reporter constructs (A) (Supplemental Table S6) were transfected into UACC62 (B) and HeLa (C). While miR-21-Region-1 and Region-2 (corresponding to the novel promoter we identified) exhibited promoter activity in both cell lines, we detected weaker activity above negative control levels from region-3 and region-4 (corresponding to the published promoter position) in HeLa, but not in UACC62. Region-4 contained the novel transcription initiation region but not the upstream conserved TF-binding sites. The Y-axis shows the firefly luciferase activity normalized to the control renilla for each sample. (D) RT–PCR was performed using primers designed for the 3′ end of pri-miR-21 construct (Cai et al. 2004) for the RT step. PCR was performed with primer pairs in A (Supplemental Table S7). (E,F) miR-17-cluster genomic regions surrounding the novel (E, red arrow pointing toward right) and host TSSs (Supplemental Table S6) were cloned upstream of luciferase reporter and transfected into UACC62. Unlike negative control constructs (region-3 and region-4), Region-1, Region-2, and host exhibited luciferase activity (F). Mutation of c-Myc site (E, blue down arrow) in miR-17-Region-2 construct (miR-17-Region-2-mutated) resulted in an approximately threefold decrease in luciferase activity relative to the wild-type construct. Data presented are mean ± SEM from three independent experiments.
Figure 3.
Figure 3.
MITF-regulated miRNAs. (A) MITF occupancy (blue down arrow) of an E-box-containing nucleosome-depleted region upstream of miR-146a transcription initiation region (red right-pointing arrow) was shown by ChIP (Supplemental Material) in MALME and UACC62. (B,C) Both pri-miR-146a (B) and mature miR-146a (C) expression levels are increased and decreased by MITF overexpression and down-regulation, respectively, using adenoviruses expressing wild-type (wt) and naturally occurring dominant-negative (dn) MITF (Du et al. 2004) and siRNA against MITF in UACC62. Data presented are mean ± SEM from three independent experiments.
Figure 4.
Figure 4.
Intronic miRNAs with independent intronic transcription initiation regions. (A) Intronic miRNAs with independent intronic transcription initiation regions are located significantly farther (median distance 57 kb) from host TSSs than those that share the host TSSs. miRNA TSSs are indicated by arrows. (B) Box plots of distance between host TSS and mature miRNA for intronic miRNAs with and without independent transcription initiation regions. There was a significant difference in the two distributions (P-value = 5.1 × 10⁻⁷), indicating that intronic miRNAs that have acquired independent promoters for faster transcription are likely located far from host gene TSSs.
Figure 5.
Figure 5.
RNAPIII-occupied miRNAs. (A) α-Amanitin sensitivities of RNAPII-transcribed miR-146a. The level of pri-miR-146a goes down quickly at a low dose of α-amanitin, supporting that it is transcribed by RNAPII and not by RNAPIII. (B) RNAPIII occupancy was observed in proximity to miR-565 transcription initation region. (C,D) α-Amanitin sensitivities of RNAPIII-transcribed miR-565 (C) and RNAPII- and RNAPIII-occupied mir-148a (D) were measured. The Y-axis shows fold change relative to the control sample, normalized to 18S rRNA. Data presented are means ± SEM from three independent experiments.
Figure 6.
Figure 6.
Nucleosome positioning in genomic regions surrounding the 3′ end of genes and mature miRNAs-coding sequences exhibits distinct patterns. (A,B) Nucleosome positioning signals at the 3′ end of genes of RefSeq genes in HeLa (A) and translation end sites in yeast (Yuan et al. 2005) (B) were aligned, and average probe signals were calculated. (C) We analyzed the nucleosome positioning maps generated by another group for human CD4+ T cells (Schones et al. 2008) and observed a similar nucleosome depletion at the 3′ ends of transcriptionally active and inactive human genes, further validating our findings. Transcriptionally active genes have less nucleosome occupancy, which may be simply due to nucleosome remodeling/eviction during transcription. (D) Nucleosome positioning signals surrounding all pre-miRNAs were aligned at pre-miRNA centers, and average probe signals were calculated. Preferential occupancy of positioned nucleosomes in pre-miRNA regions (Supplemental Fig. S9C) was observed.

References

    1. Alvarez-Garcia I., Miska E.A. MicroRNA functions in animal development and human disease. Development. 2005;132:4653–4662. - PubMed
    1. Ambros V. The functions of animal microRNAs. Nature. 2004;431:350–355. - PubMed
    1. Anderson J.D., Widom J. Sequence and position-dependence of the equilibrium accessibility of nucleosomal DNA target sites. J. Mol. Biol. 2000;296:979–987. - PubMed
    1. Aravin A.A., Lagos-Quintana M., Yalcin A., Zavolan M., Marks D., Snyder B., Gaasterland T., Meyer J., Tuschl T. The small RNA profile during Drosophila melanogaster development. Dev. Cell. 2003;5:337–350. - PubMed
    1. Barski A., Cuddapah S., Cui K., Roh T.Y., Schones D.E., Wang Z., Wei G., Chepelev I., Zhao K. High-resolution profiling of histone methylations in the human genome. Cell. 2007;129:823–837. - PubMed

Publication types

LinkOut - more resources