. 2008 Dec;4(12):e1000289.
doi: 10.1371/journal.pgen.1000289. Epub 2008 Dec 5.

Loss of Kindlin-1 causes skin atrophy and lethal neonatal intestinal epithelial dysfunction

Affiliations

Loss of Kindlin-1 causes skin atrophy and lethal neonatal intestinal epithelial dysfunction

Siegfried Ussar et al. PLoS Genet. 2008 Dec.

Abstract

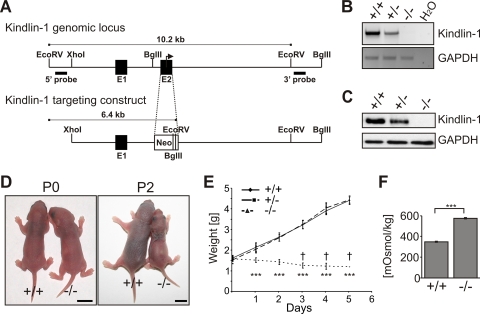
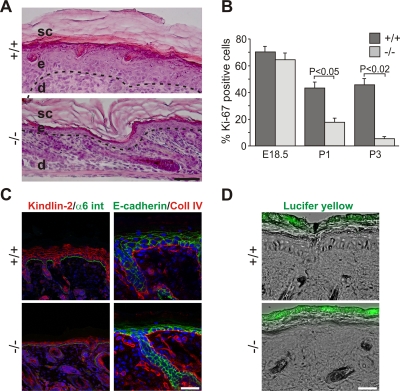
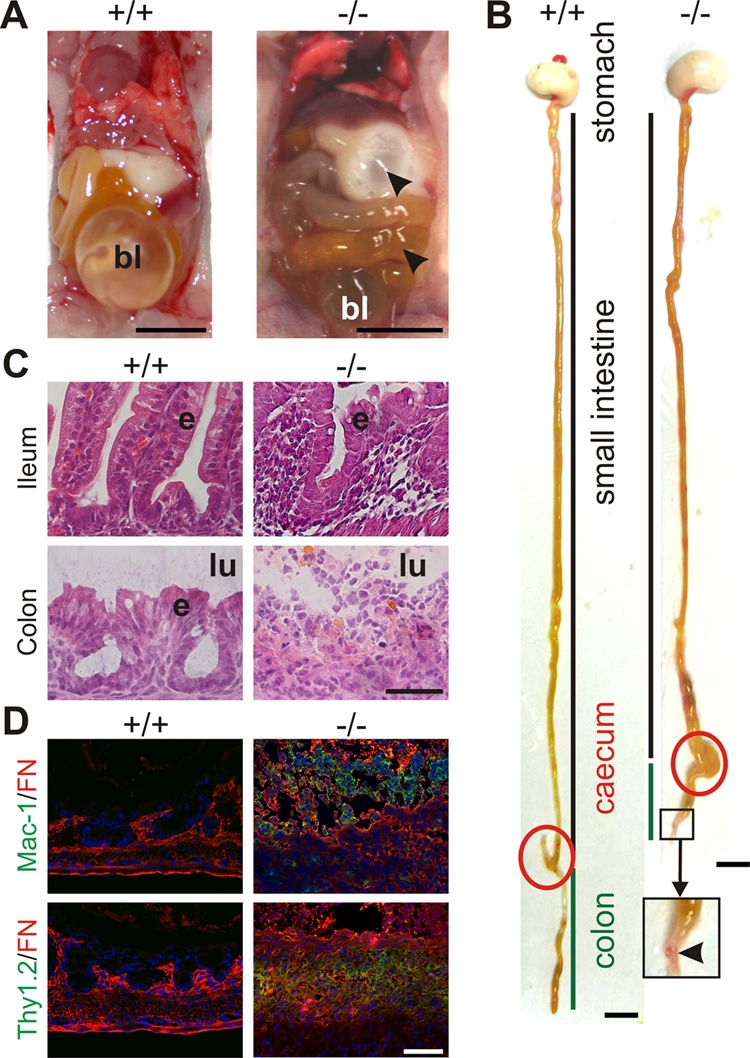
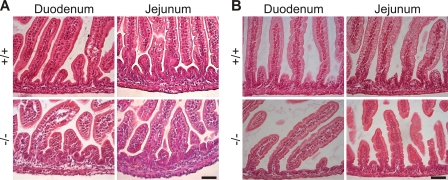
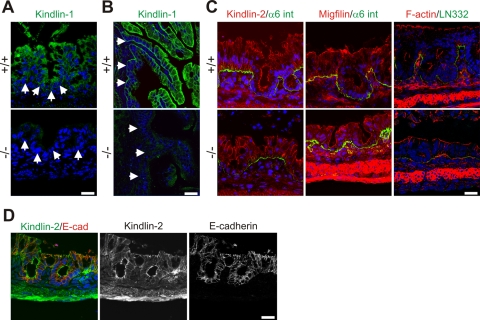
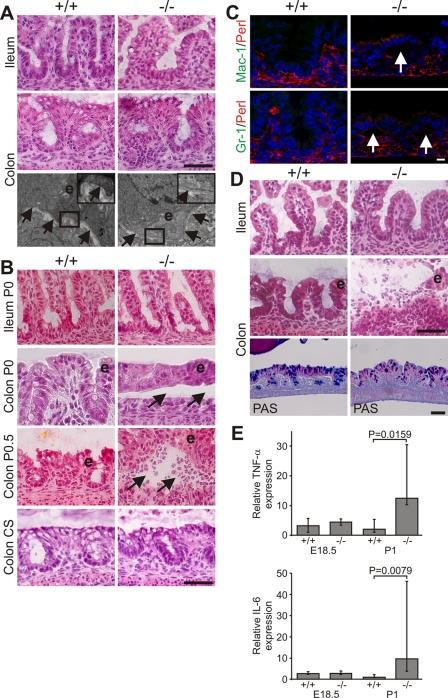
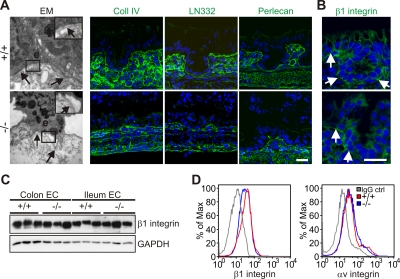
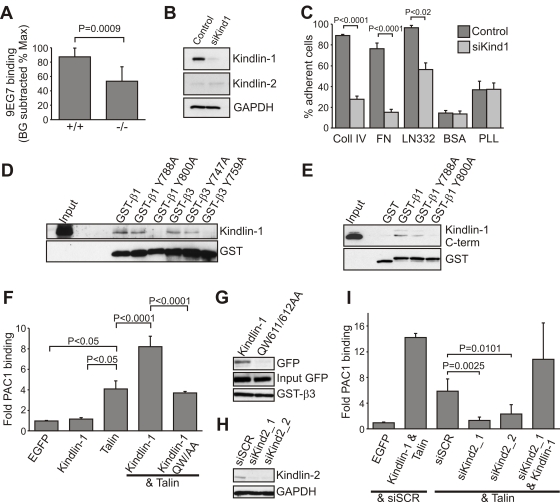
Kindler Syndrome (KS), characterized by transient skin blistering followed by abnormal pigmentation, skin atrophy, and skin cancer, is caused by mutations in the FERMT1 gene. Although a few KS patients have been reported to also develop ulcerative colitis (UC), a causal link to the FERMT1 gene mutation is unknown. The FERMT1 gene product belongs to a family of focal adhesion proteins (Kindlin-1, -2, -3) that bind several beta integrin cytoplasmic domains. Here, we show that deleting Kindlin-1 in mice gives rise to skin atrophy and an intestinal epithelial dysfunction with similarities to human UC. This intestinal dysfunction results in perinatal lethality and is triggered by defective intestinal epithelial cell integrin activation, leading to detachment of this barrier followed by a destructive inflammatory response.


Conflict of interest statement

The authors have declared that no competing interests exist.

Figures

Figure 1
Figure 1. Loss of Kindlin-1 results in early postnatal lethality.
(A) The Fermt1 gene was disrupted by replacing the ATG start codon containing exon 2 with a neomycin resistance cassette. (B) Kindlin-1 mRNA levels were determined by PCR from cDNAs derived from P3 kidneys. (C) Loss of Kindlin-1 protein was confirmed by western blotting in colonic IEC lysates. (D) Pictures from newborn (P0) and two day old mice (P2). Scale bars represent 5mm. (E) Weight curve of Kindlin-1−/− (n = 8) and control littermates (+/+; n = 8; +/−; n = 9) where a † indicates when mice died. *** indicates a P-value <0.0001. Error bars show standard deviations. (F) Osmolarity of P2 Kindlin-1−/− and control (+/+) urine (n = 3 per genotype). Error bars show standard deviations. *** indicates a P-value <0.0001.
Figure 2
Figure 2. Atrophy and reduced proliferation in Kindlin-1−/− skin.
(A) H&E stainings from P3 backskin show severe epidermal atrophy in Kindlin-1−/− mice. The BM is indicated by a dashed line and separates the epidermis (e) from the dermis (d). sc: stratum corneum. Scale bar indicates 50 µm. (B) Percentage of Ki67-positive interfollicular keratinocytes, indicating proliferating cells, at different ages (n = 7 per genotype). Error bars show standard errors of the mean. (C) Kindlin-2 (red; co-stained with α6 integrin (α6 int; in green) and E-cadherin (green, co-stained with Collagen IV (Coll IV) in red) staining of P3 backskin sections. Nuclei are shown in blue. Scale bar indicates 10 µm. (D) FITC-Lucifer yellow stain of P3 backskin overlaid with DIC. Lack of lucifer yellow dye penetration shows normal skin barrier in Kindlin-1−/− mice. Scale bar indicates 50 µm.
Figure 3
Figure 3. Severe inflammation and epithelial detachment in Kindlin-1−/− colon.
(A) Opened abdomen with intestine from P2 mice. Arrowheads indicate air in the stomach and small intestine of Kindlin-1−/− mice. bl; bladder. Scale bar represents 5 mm. (B) Whole gut preparations from P2 mice. Scale bar represents 5 mm. Arrowhead indicates a stricture in the distal colon. The caecum is highlighted with a red circle and the colon is marked with a green line. (C) H&E staining of P3 colon and ileum. Kindlin-1−/− mice show complete absence of colonic epithelium (e), exposure of the submucosa to the intestinal lumen (lu) and severe inflammation in colon and ileum. Scale bar represents 50 µm. (D) Macrophage and granulocyte infiltrations in P3 colon shown with Mac-1 staining in green. T-cell infiltrates in P3 colon shown with Thy1.2 staining in green. Fibronectin (FN) is stained in red. Scale bar represents 50 µm.
Figure 4
Figure 4. Normal duodenum and jejunum in Kindlin-1−/− mice.
H&E stainings of (A) P1 and (B) P3 duodenal and jejunal sections reveal a normal histology of the Kindlin-1−/− small intestine. Scale bar represents 50 µm.
Figure 5
Figure 5. Kindlin-1 localization in mouse intestine.
(A) Immunofluorescence staining of Kindlin-1 in neonatal colon. Arrows indicate BM. (B) Immunofluorescence staining of P1 ileum for Kindlin-1. Arrows indicate the BM. (C) Immunofluorescence staining of P1 colon for Kindlin-2, Migfilin, F-actin (red), α6 integrin (α6 int; green) and Laminin-332 (LN332; green). (D) Immunofluorescence staining of colon for Kindlin-2 (green) and E-cadherin (E-cad; red). All scale bars represent 10 µm.
Figure 6
Figure 6. Progressive epithelial dysfunction in Kindlin-1−/− mice.
(A) Normal morphology of IECs and BM at E18.5. Shown are H&E stainings of the ileum and colon and electron microscopy pictures at 12000× magnification from the colon. The boxed enlargement shows the BM, e: epithelium. Arrows point to the BM. (B) Colonic IEC (e) detachment at P0 (Colon P0, around 5–6 hours after birth) that becomes infiltrated by immune cells around 12 hours after birth (Colon P0.5). In mice delivered by Caesarean section (CS) and kept unfed for 7 hours no epithelial cell detachment can be observed. Arrows indicate blister. (C) IEC detachment but no macrophage (Mac-1) and granulocyte (GR-1) infiltrations at P0 (Mac-1 and GR-1 in green; Perlecan (Perl) indicating BM in red). Arrows indicate IEC detachment. (D) Immune cell infiltrations in the lumen of the colon and floating epithelial sheets (e) in the colonic lumen at P1. PAS staining shows reduced goblet cell mucins in Kindlin-1−/− colonic epithelium. Scale bars in A, B and D represent 50 µm and in C 10 µm. (E) Median of Real Time PCR results from whole colon mRNA at E18.5 (n = 2 per genotype) and P1 (n = 5 per genotype) for TNF-α and IL-6. Error bars show range. The P value was determined using a Mann-Whitney test.
Figure 7
Figure 7. Normal BM composition and integrin localization in P1 colon.
(A) Electron micrograph at 12000× magnification shows detachment of colonic IECs from the BM at P1. Arrows point to the BM. The boxed enlargement shows the BM, e: epithelium. Cryo-sections from the colon of P1 Kindlin-1+/+ and Kindlin-1−/− mice stained for Collagen IV (Coll IV), Laminin-332 (LN332) and Perlecan. The staining of them shows a normal distribution and localization in Kindlin-1−/− colon. Scale bar represents 10 µm. (B) β1 integrin staining of P1 colon. Arrows indicate the BM. Scale bar represents 10 µm. (C) Western blot from IECs for β1 integrin. (D) β1 and αv integrin FACS profile on primary IECs.
Figure 8
Figure 8. Kindlin-1 association with β integrins is required for Talin-mediated integrin activation.
(A) Kindlin-1 IECs display significantly reduced 9EG7 binding (active β1 integrin). The 9EG7 binding was quantified by subtracting background (BG) values from mean fluorescence intensity (MFI) values and normalized to total β1 integrin expression (n = 8 mice per genotype). Error bars show standard deviations. (B) Western blot from HT-29 cells expressing a control siRNA or a siRNA directed against hKindlin-1 (siKind1) for Kindlin-1 and Kindlin-2. GAPDH was used to show equal loading. (C) Adhesion assay of control and Kindlin-1-depleted HT-29 cells on the indicated substrates (n = 5). Shown are mean values, error bars show standard errors of the mean. Coll IV, Collagen IV; FN, Fibronectin; LN332, Laminin-332; PLL, Poly-L lysine. (D) Kindlin-1 pull-down from IEC lysates using GST-tagged cytoplasmic β integrin tails. (E) Direct interaction of Kindlin-1 with β1 integrin cytoplasmic tails. His-tagged Kindlin-1 C-terminus was co-precipitated with GST-tagged β1 integrin cytoplasmic tails, but not with GST alone or an Y800A mutant form of β1 integrin. (F) Quantification of αIIbβ3 integrin activation, as measured by activation specific antibody PAC1 in CHO cells using flow cytometry (n = 9). Shown are mean values, error bars show standard deviations. (G) Pull-down with GST-tagged cytoplasmic β3 integrin tail from CHO cells transiently transfected with the indicated EGFP-constructs. (H) Western blot of CHO cells 24 hours after transfection with the indicated siRNAs. (siSCR: scrambled; siKind2_1 and siKind2_2: Kindlin-2 specific siRNAs) (I) Quantification of αIIbβ3 integrin activation in CHO cells transfected with the indicated cDNA constructs and/or siRNAs (n = 8). Shown are mean values, error bars show standard deviations.

References

    1. Siegel DH, Ashton GH, Penagos HG, Lee JV, Feiler HS, et al. Loss of kindlin-1, a human homolog of the Caenorhabditis elegans actin-extracellular-matrix linker protein UNC-112, causes Kindler syndrome. Am J Hum Genet. 2003;73:174–187. - PMC - PubMed
    1. Jobard F, Bouadjar B, Caux F, Hadj-Rabia S, Has C, et al. Identification of mutations in a new gene encoding a FERM family protein with a pleckstrin homology domain in Kindler syndrome. Hum Mol Genet. 2003;12:925–935. - PubMed
    1. Lai-Cheong JE, Liu L, Sethuraman G, Kumar R, Sharma VK, et al. Five new homozygous mutations in the KIND1 gene in Kindler syndrome. J Invest Dermatol. 2007;127:2268–2270. - PubMed
    1. Kern JS, Herz C, Haan E, Moore D, Nottelmann S, et al. Chronic colitis due to an epithelial barrier defect: the role of kindlin-1 isoforms. J Pathol. 2007;213:462–470. - PubMed
    1. Ussar S, Wang HV, Linder S, Fassler R, Moser M. The Kindlins: subcellular localization and expression during murine development. Exp Cell Res. 2006;312:3142–3151. - PubMed

Publication types

MeSH terms

LinkOut - more resources