. 2008 Dec;4(12):e1000293.
doi: 10.1371/journal.pgen.1000293. Epub 2008 Dec 5.

The genomic analysis of lactic acidosis and acidosis response in human cancers

Affiliations

The genomic analysis of lactic acidosis and acidosis response in human cancers

Julia Ling-Yu Chen et al. PLoS Genet. 2008 Dec.

Abstract

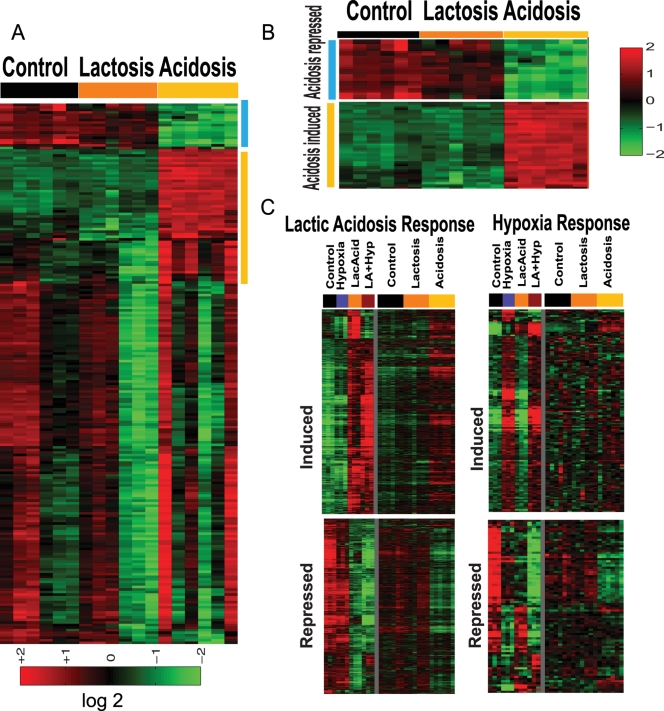
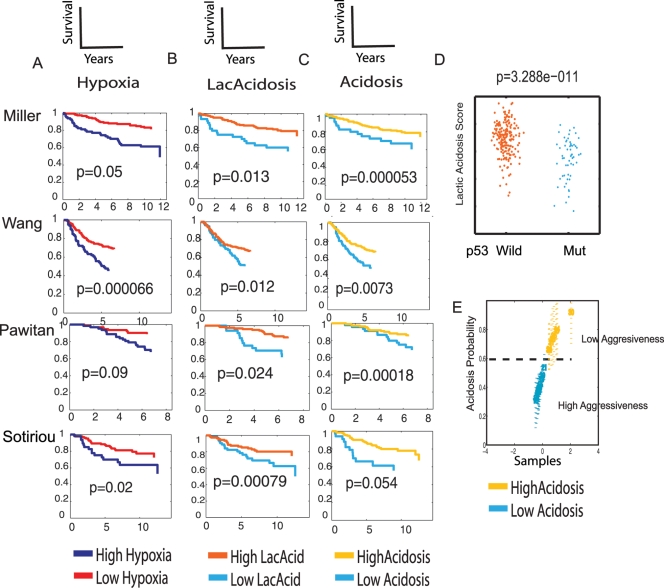
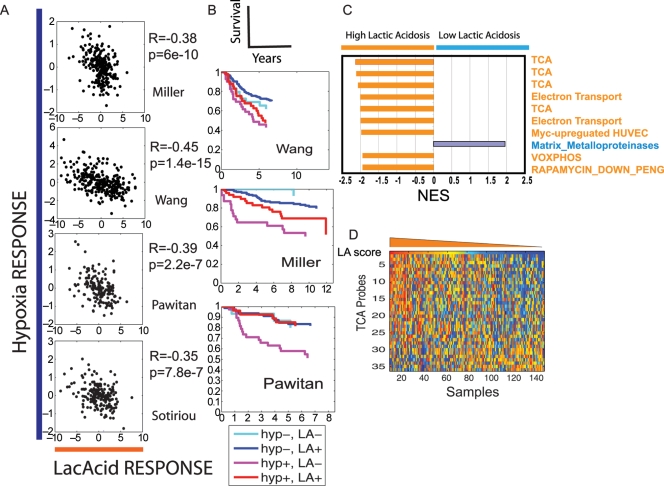
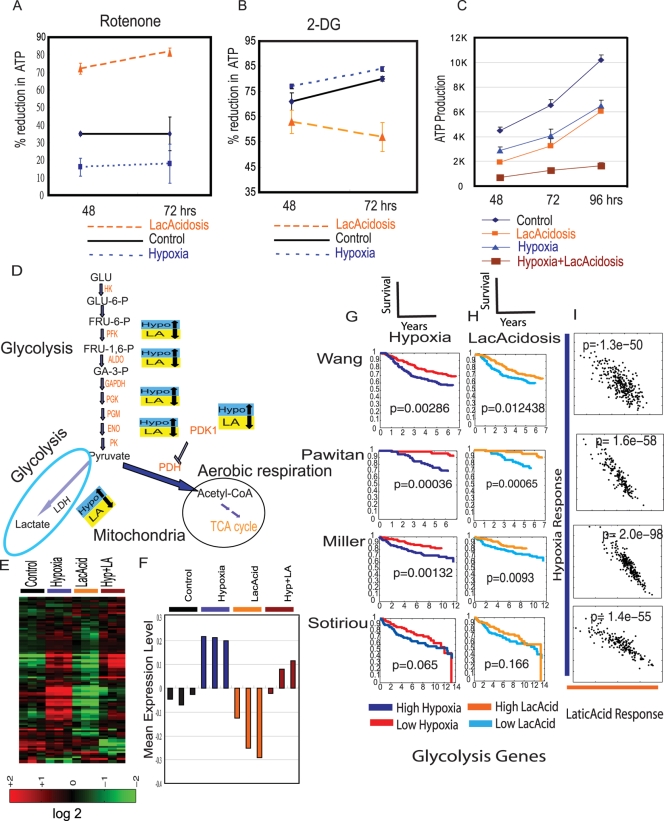
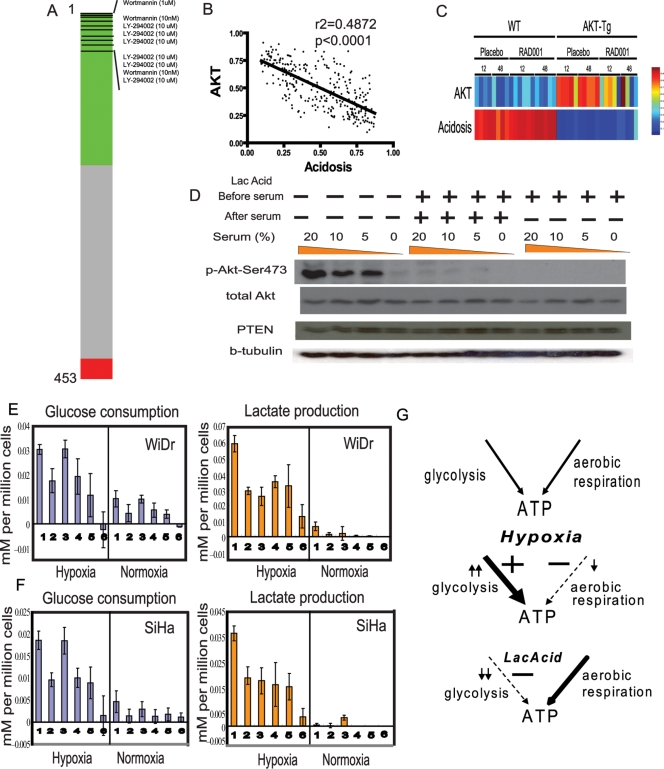
The tumor microenvironment has a significant impact on tumor development. Two important determinants in this environment are hypoxia and lactic acidosis. Although lactic acidosis has long been recognized as an important factor in cancer, relatively little is known about how cells respond to lactic acidosis and how that response relates to cancer phenotypes. We develop genome-scale gene expression studies to dissect transcriptional responses of primary human mammary epithelial cells to lactic acidosis and hypoxia in vitro and to explore how they are linked to clinical tumor phenotypes in vivo. The resulting experimental signatures of responses to lactic acidosis and hypoxia are evaluated in a heterogeneous set of breast cancer datasets. A strong lactic acidosis response signature identifies a subgroup of low-risk breast cancer patients having distinct metabolic profiles suggestive of a preference for aerobic respiration. The association of lactic acidosis response with good survival outcomes may relate to the role of lactic acidosis in directing energy generation toward aerobic respiration and utilization of other energy sources via inhibition of glycolysis. This "inhibition of glycolysis" phenotype in tumors is likely caused by the repression of glycolysis gene expression and Akt inhibition. Our study presents a genomic evaluation of the prognostic information of a lactic acidosis response independent of the hypoxic response. Our results identify causal roles of lactic acidosis in metabolic reprogramming, and the direct functional consequence of lactic acidosis pathway activity on cellular responses and tumor development. The study also demonstrates the utility of genomic analysis that maps expression-based findings from in vitro experiments to human samples to assess links to in vivo clinical phenotypes.


Conflict of interest statement

The authors have declared that no competing interests exist.

Figures

Figure 1
Figure 1. Overview of the cellular responses to hypoxia and lactic acidosis.
(A,B) The gene expression response of HEMC is shown when exposed to control, hypoxia, lactic acidosis and combined hypoxia and lactic acidosis conditions. 4722 genes with expression variations of at least 1.75 fold in two samples were selected and hierarchically clustered. Genes induced by hypoxia (vertical blue bar), lactic acidosis (pink), and repressed by lactic acidosis (orange) are marked and further expanded in (B). (C) The expression of three lactic acidosis-induced genes ERBB3, CD55 and PLAUR normalized by actin-beta were confirmed by real time RT-PCR. Similar results were observed when normalized by another control gene, B2M (D) Venn diagram showing the number of genes changed by lactic acidosis (1585 genes), hypoxia (217 genes) and overlap (54 genes) for whom the probability of an expression change exceeded 0.99. (E, F) The expression of genes comprising hypoxia (E) and genes comprising lactic acidosis (F) gene signatures was shown in respective heat maps in all four indicated conditions.
Figure 2
Figure 2. The cellular responses to lactosis and acidosis.
(A) HMECs were exposed to three indicated environments: control, lactosis, and acidosis. 213 genes with expression varied from the mean at least 1.75 fold in 4 samples were selected and hierarchically clustered. A cluster of genes strongly induced by acidosis is shown (yellow vertical bar). (B) The expression of genes comprising acidosis gene signatures under indicated conditions was shown in heat maps. The expression of genes selected by statistical analysis (see Text S1) for whom the probability of an expression change under lactic acidosis (C) or hypoxia (D) exceeds 0.99 were shown under hypoxia/lactic acidosis or lactosis/acidosis. Most lactic acidosis-induced/repressed genes are also induced/repressed by acidosis but not lactosis.
Figure 3
Figure 3. The prognostic significance of gene signatures reflecting hypoxia, lactic acidosis and acidosis response in human breast cancers.
The gene signatures in hypoxia (A), lactic acidosis (B), and acidosis (C) response were assessed in the four indicated breast cancer expression datasets. The tumors stratified by the degrees of these responses were used to generate the Kaplan-Meier survival curves for the clinical outcomes exhibiting high and low indicated responses are shown. (D) In the Miller dataset, the lactic acidosis response score is significantly higher among the tumors with wild type p53 than mutant p53 (p = 3.288×10⁻¹¹). (E) Acidosis response were also estimated for a group of breast cancer cell lines with different metastatic abilities and found to be negatively correlated with tumor aggressiveness determined in xenografted mice .
Figure 4
Figure 4. The exploration of lactic acidosis response in breast cancers.
(A) Scatter plots showing the relationship between the probability of hypoxia response (Y-axis) and lactic acidosis response (X-axis). Each point in the scatter plots represents a single tumor from the indicated breast cancer data sets. The overall correlation (R) and probability (p) between hypoxia and lactic acidosis signatures across all samples is shown for the indicated data set. (B) The tumors in the indicated breast cancer data set are separated into four groups based on hypoxia and lactic acidosis responses. Kaplan-Meier curves for the clinical outcomes of these four groups of tumors are shown with indicated colors. (C) The top ten genesets based on normalized enrichment score (NES) from GSEA analysis for the difference in pathway composition between the tumors with high vs. low lactic acidosis responses in the Pawitan data. (D) The breast samples in the Pawitan data was arranged from left to right by descending lactic acidosis score (top row). The expression of genes in TCA cycles in these samples is shown in heat map (orange means higher expression whereas blue means lower expression) together with lactic acidosis score.
Figure 5
Figure 5. Lactic acidosis directs toward aerobic respiration by inhibiting the expression of glycolytic genes (A,B).
The contribution of aerobic respiration and glycolysis to ATP generation under control, lactic acidosis and hypoxia is measured by the degree of inhibition of ATP generation after treatment of rotenone (A) and 2-DG (B) at the indicated time after treatment. (C) The amount of ATP generation at different time points under the indicated conditions. (D) The genes in the glycolysis pathways were up-regulated by hypoxia and down-regulated by lactic acidosis. (E) The expression of genes listed as “glycolysis pathway” was extracted and clustered. (F) The mean expression values of the 53 glycolysis genes for each HMEC under hypoxia, lactic acidosis and hypoxia/lactic acidosis are calculated and shown. (G)(H) The expression of genes in the glycolytic pathways under hypoxia and lactic acidosis were used to predict the pathways activity and stratified the indicated breast cancer samples. This small set of genes recapitulated the result using the whole lactic acidosis and hypoxia gene signatures. (I) Scatter plots showing the relationship between the probability of hypoxia response (Y-axis) and lactic acidosis response (X-axis) for genes in the glycolysis pathways. Each point in the scatter plots represents a single tumor from the indicated breast cancer data sets. The probability (p) between hypoxia and lactic acidosis signatures across all samples in the indicated data set is shown.
Figure 6
Figure 6. Lactic acidosis inhibits Akt and glycolytic phenotypes of cancer cells.
(A) PI3K inhibitors are highly ranked with lactic acidosis signature in the connectivity map analysis. The “barview” is constructed from 453 horizontal lines, each representing an individual treatment instance, ordered by their corresponding connectivity scores calculated with lactic acidosis signature (+1, top; −1, bottom) with the instances corresponding to wormannin and LY-294002 were shown as black bars. Colors applied to the remaining instances reflect the sign of their scores (green, positive; gray, null; red, negative). (B), (C) The relationship between the predicted Akt and Acidosis pathway activities in the gene expression pattern of a breast cancer expression studies (B) and prostate tissue is shown between wild (WT) and Akt transgenic mouse (AKT-Tg) treated with placebo or mTOR inhibitor RAD001. (D) The effect of lactic acidosis on Akt activation in DU145 cells during serum exposure. Indicated amount of serum are added to the DU145 which have been placed in 0.2% serum conditions for 24 hours without (−) or with (+) 25 mM lactic acid. The same amount of cell lysates of DU145 cultured under indicated conditions were separated, transferred to blot and probed with indicated antibodies. (E), (F) The amount (mM) of lactate production (orange) and glucose consumption (blue) in 48 hour per million of WiDr (E) and SiHa (F) cells under hypoxia (left) or normoxia (right) with the following media conditions (1) control, (2) 25 mM lactic acidosis (pH 6.7), (3) 25 mM sodium lactate, (4) pH 6.7, (5) pH 6.5, (6) pH 6.0. (G) The model of the differentially modulated the balance of glycolysis and aerobic respiration as means of energy generation under control, hypoxia and lactic acidosis.

References

    1. Vaupel P. Tumor microenvironmental physiology and its implications for radiation oncology. Semin Radiat Oncol. 2004;14:198–206. - PubMed
    1. Helmlinger G, Yuan F, Dellian M, Jain RK. Interstitial pH and pO2 gradients in solid tumors in vivo: high-resolution measurements reveal a lack of correlation. Nat Med. 1997;3:177–182. - PubMed
    1. Vaupel P, Hockel M. Blood supply, oxygenation status and metabolic micromilieu of breast cancers: characterization and therapeutic relevance. Int J Oncol. 2000;17:869–879. - PubMed
    1. Gatenby RA, Gillies RJ. Why do cancers have high aerobic glycolysis? Nat Rev Cancer. 2004;4:891–899. - PubMed
    1. Cardone RA, Casavola V, Reshkin SJ. The role of disturbed pH dynamics and the Na+/H+ exchanger in metastasis. Nat Rev Cancer. 2005;5:786–795. - PubMed

Publication types