Review
. 2009 Mar;45(1 Suppl):S163-72.
doi: 10.1016/j.neuroimage.2008.10.057. Epub 2008 Nov 13.

A review of group ICA for fMRI data and ICA for joint inference of imaging, genetic, and ERP data

Affiliations
Review

A review of group ICA for fMRI data and ICA for joint inference of imaging, genetic, and ERP data

Vince D Calhoun et al. Neuroimage. 2009 Mar.

Abstract

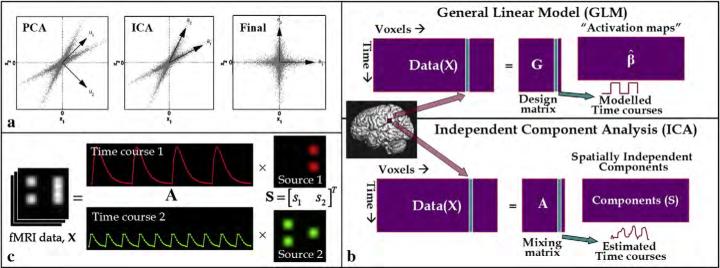
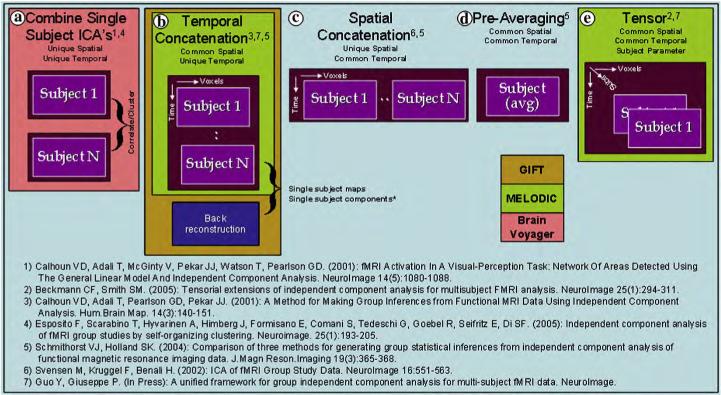
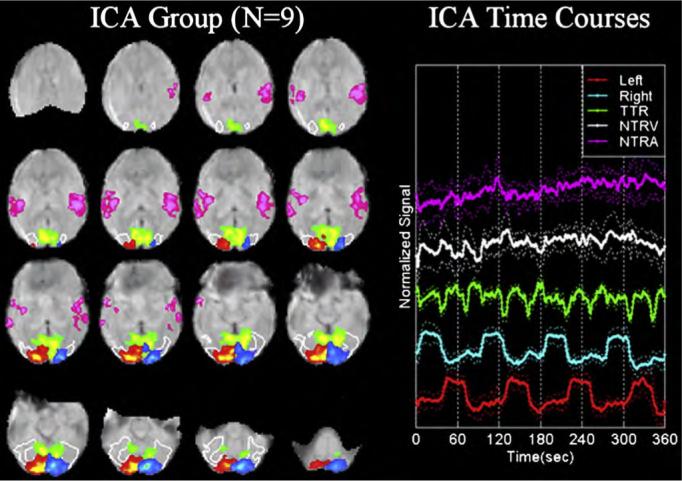
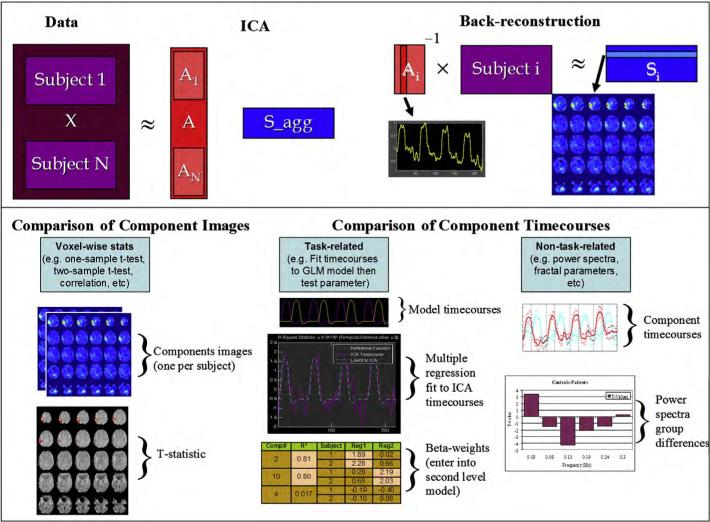
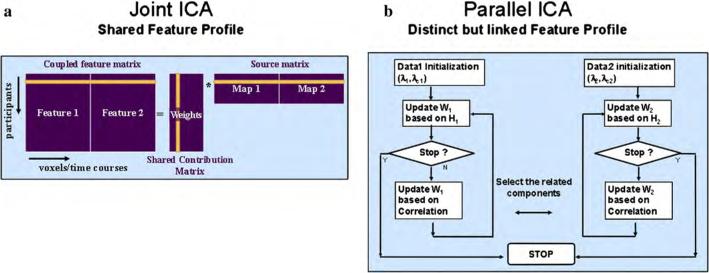
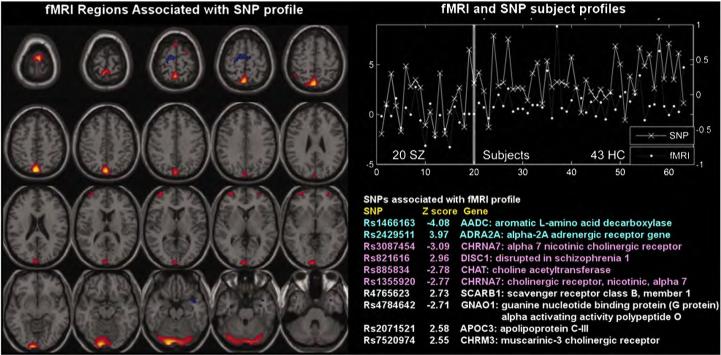
Independent component analysis (ICA) has become an increasingly utilized approach for analyzing brain imaging data. In contrast to the widely used general linear model (GLM) that requires the user to parameterize the data (e.g. the brain's response to stimuli), ICA, by relying upon a general assumption of independence, allows the user to be agnostic regarding the exact form of the response. In addition, ICA is intrinsically a multivariate approach, and hence each component provides a grouping of brain activity into regions that share the same response pattern thus providing a natural measure of functional connectivity. There are a wide variety of ICA approaches that have been proposed, in this paper we focus upon two distinct methods. The first part of this paper reviews the use of ICA for making group inferences from fMRI data. We provide an overview of current approaches for utilizing ICA to make group inferences with a focus upon the group ICA approach implemented in the GIFT software. In the next part of this paper, we provide an overview of the use of ICA to combine or fuse multimodal data. ICA has proven particularly useful for data fusion of multiple tasks or data modalities such as single nucleotide polymorphism (SNP) data or event-related potentials. As demonstrated by a number of examples in this paper, ICA is a powerful and versatile data-driven approach for studying the brain.


Figures

Fig. 1
Fig. 1
a) Illustration of the need for higher order statistics: principle component analysis (PCA) identifies orthogonal directions which capture the most variance (a second order statistic) whereas ICA finds maximally independent directions using higher order statistics, b) Comparison of GLM and spatial ICA for fMRI data: the GLM requires the specification of the temporal model in the design matrix, whereas ICA estimates the timecourses from the data by maximizing independences between the component images, and c) Illustration of spatial ICA of fMRI data: the fMRI data is assumed to be comprised of linearly mixed sources, which are extracted via ICA along with their corresponding timecourses.
Fig. 2
Fig. 2
Several Group ICA Approaches: A comparison of 5 group ICA approaches and some of the software packages which implement these methods as a primary pipeline. a) separate ICA analyses run on each subjects, followed by correlation or clustering to enable group interference, b) temporal concatenation followed by an aggregate ICA analysis is a popular approach which also can include a back-reconstruction step to compute single subject maps and timecourses, c) spatial concatenation or d) pre-averaging prior to ICA have also been proposed. Finally, e) tensor based approaches stack the data into a cube.
Fig. 3
Fig. 3
fMRI Group ICA results (from Calhoun et al., 2001b): Group ICA identifies temporally coherent networks which are spatially distinct. In a relatively simple visual stimulation paradigm ICA identified strongly task-related networks (blue, red) as well as transient and non-task related networks (green, white, pink).
Fig. 4
Fig. 4
Graphical Illustration of Group ICA as implemented in GIFT: Group ICA as implemented in GIFT incorporates temporal concatenation plus a back-reconstruction step to produce single subject maps and timecourses. The individual subject data is projected onto the subject-specific partition of the mixing matrix to compute the corresponding single-subject component image (top panel). Which of these components is of interest depends upon the question being asked which can draw upon comparisons of the component images or timecourses. Group ICA enables voxel-wise testing of the components images or fitting of a model to the component timecourses (bottom panel).
Fig. 5
Fig. 5
Illustration of joint ICA and Parallel ICA models: Joint ICA (left) assumes a shared contribution matrix for the two modalities. Parallel ICA (right) updates separate ICA processes using the correlation between the subject profiles for the two modalities.
Fig. 6
Fig. 6
Naturalistic driving (from Calhoun et al., 2002): Multiple networks identified during simulated driving. ICA enables us to study the complex and overlapping dynamics that occur during a naturalistic task.
Fig. 7
Fig. 7
Pair-wise comparisons of the Control, Schizophrenia, and Bipolar Groups (from Calhoun et al., 2008): Two-sample t-tests were performed to illustrate most significant differences for each pair-wise comparison (left). Note that these maps are generated from all subjects and actual classification regions will be slightly different due to the leave-1-out approach. On the right is plotted the average beta weights for the stimuli broken out by group.
Fig. 8
Fig. 8
Fusion of ERP and fMRI data (from Eichele et al., 2008): Time course and topography for EEG-tIC1 for standard and target epochs as well as the difference wave between them. The difference wave was subjected to a pointwise one-sample t-test, black dots indicate timeframes with significant difference from zero at p<.05, Bonferroni corrected for 512 tests (t>6.93). The bilateral temporal activation in the linked fMRI component is shown as a surface rendering (top right). Additional slices in the lower half illustrate the overall spatial pattern. The maps are thresholded at 1% false discovery rate, cluster extent 5 voxels. Positive correlation is plotted in red, inverse correlation in blue.
Fig. 9
Fig. 9
Fusion of fMRI and genetic (SNP) data (from Liu et al., In Press): Parallel ICA provides an fMRI part (left) and a SNP part (bottom right) in addition to a correlated subject profile for both fMRI and SNP data (top right).

References

    1. Adali T, Novey M, Cardoso JF, Adali T, Novey M, Cardoso JF. Complex ICA using nonlinear functions. IEEE Trans. Signal Process. 2008;59:4356–4544.
    1. Ardnt C. 1996. Information gained by data fusion.
    1. Bach F, Jordan M. Kernel independent component analysis. J. Mach. Learn. Res. 2002;3:1–48.
    1. Beckmann CF, Smith SM. Probabilistic independent component analysis for functional magnetic resonance imaging. IEEE Trans. Med. Imaging. 2004;23(2):137–152. - PubMed
    1. Beckmann CF, Smith SM. Tensorial extensions of independent component analysis for multisubject FMRI analysis. NeuroImage. 2005;25(1):294–311. - PubMed

Publication types