. 2009 Mar;45(1 Suppl):S133-42.
doi: 10.1016/j.neuroimage.2008.10.060. Epub 2008 Nov 14.

Group analysis of DTI fiber tract statistics with application to neurodevelopment

Affiliations

Group analysis of DTI fiber tract statistics with application to neurodevelopment

Casey B Goodlett et al. Neuroimage. 2009 Mar.

Abstract

Diffusion tensor imaging (DTI) provides a unique source of information about the underlying tissue structure of brain white matter in vivo including both the geometry of major fiber bundles as well as quantitative information about tissue properties represented by derived tensor measures. This paper presents a method for statistical comparison of fiber bundle diffusion properties between populations of diffusion tensor images. Unbiased diffeomorphic atlas building is used to compute a normalized coordinate system for populations of diffusion images. The diffeomorphic transformations between each subject and the atlas provide spatial normalization for the comparison of tract statistics. Diffusion properties, such as fractional anisotropy (FA) and tensor norm, along fiber tracts are modeled as multivariate functions of arc length. Hypothesis testing is performed non-parametrically using permutation testing based on the Hotelling T(2) statistic. The linear discriminant embedded in the T(2) metric provides an intuitive, localized interpretation of detected differences. The proposed methodology was tested on two clinical studies of neurodevelopment. In a study of 1 and 2 year old subjects, a significant increase in FA and a correlated decrease in Frobenius norm was found in several tracts. Significant differences in neonates were found in the splenium tract between controls and subjects with isolated mild ventriculomegaly (MVM) demonstrating the potential of this method for clinical studies.


Figures

Fig. 1
Fig. 1
All images in a study are used to compute an atlas. Fiber tractography in the atlas produces a template atlas fiber tract. Inverse transformations are used to map the template tract back into the individual subjects to collect along tract measurements of tensor properties. The parametrization given by the atlas is used to compute statistics on the tract oriented functions.
Fig. 2
Fig. 2
The top row shows axial, sagittal, and coronal slices of the FA image from a DTI scan of a 1 year old subject. The bottom row shows the result of the structural operator on the FA image taken at σ = 2.0mm. Major fiber bundles such as the (a)genu of the corpus callosum, (b)splenium of the corpus callosum, (c) fornix, and (d)internal capsules are highlighted, while the background noise is muted.
Fig. 3
Fig. 3
The diffusion properties within a fiber bundle (a) are summarized as a function of arc length (b). For example, the FA value along the cross-section at points A,B,C,D,E are averaged and become the value of the function at the points A,B,C,D,E along the x-axis of the arc length function.
Fig. 4
Fig. 4
Visualization of the PCA modes for the joint analysis of FA and Frobenius norm in the genu of the corpus callosum for the one and two year old populations. The (a) mean function for the combined population are shown with (b) the first and (c) second PCA modes. The first PCA mode accounts for a large percentage of the variability and shows constant changes of FA with a corresponding anti-correlated change in Frobenius norm.
Fig. 5
Fig. 5
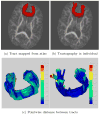
The genu tract (a) mapped from atlas is compared with (b) the tract produced by tractography in the individual. Comparison of pointwise distances between the two fiber tracts reveals a maximum difference of 4.5mm between the two tracts. The average distance in the main body of the tract is less than 1.5mm.
Fig. 6
Fig. 6
(a) Genu and (d) splenium tracts extracted from the tensor atlas with color indicating mean FA value. The diffusion values are sampled along the atlas-normalized arc length for each individual in the study for FA and Frobenius norm values. The sampled FA and Frobenius norm functions for the two groups are shown in (b), (c), (e), (f). The one year old subjects are the dashed red lines and the two year old subjects are the solid blue lines. The spikes in the center of the Frobenius norm functions for the genu are due to partial voluming with fluid in the longitudinal fissure.
Fig. 7
Fig. 7
(a) Left and (d) right cortico-spinal tracts, cropped in the internal capsule, in the one and two year old population. The tracts are sampled from inferior to superior along the tract to produce the sampled functions in (b), (c), (e) and (f).
Fig. 8
Fig. 8
(a) The mean functions for the genu tract one and two year old groups along with (b) the linear discriminant which describes the function that maximizes separation between the groups. Here, the FA values increase from one to two years, and the Frobenius norm values decrease in a correlated manner. The FA changes are localized towards the center of the tract and are less informative at both the left and right ends of the tract.
Fig. 9
Fig. 9
(a) The mean functions of the left cortico-spinal tract for the one and two year old groups along with (b) the linear discriminant which describes the function which maximizes separation between the groups. Here FA increases in regions inferior of the callosal fibers and decreases as the tract passes near the corpus callosum. This could indicate increased interaction and crossing between fibers in this region.
Fig. 10
Fig. 10
Template fiber tracts in atlas of neonate subjects overlaid on the FA image of atlas.
Fig. 11
Fig. 11
(a) The mean functions for the splenium tract in control and MVM neonates are shown along with the (b) Fisher linear discriminant. The discriminant indicates that the significant differences in tract properties are attributed to an decrease in FA and a increase in Frobenius norms in MVMs.

References

    1. Alexander D, Pierpaoli C, Basser PJ, Gee J. Spatial transformations of diffusion tensor magnetic resonance images. Medical Imaging, IEEE Transactions on. 2001 Nov;20 (11):1131–1140. - PubMed
    1. Arsigny V, Fillard P, Pennec X, Ayache N. Log-Euclidean metrics for fast and simple calculus on diffusion tensors. Magnetic Resonance in Medicine. 2006;56 (2):411–421. - PubMed
    1. Barnea-Goraly N, Kwon H, Menon V, Eliez S, Lotspeich L, Reissa AL. White matter structure in autism: preliminary evidence from diffusion tensor imaging. Biological Psychiatry. 2004 Feb;55 (3):323–326. - PubMed
    1. Basser P, Pierpaoli C. Microstructural and physiological features of tissues elucidated by quantitative DT-MRI. Journal Magnetic Resonance. 1996 Jun;111 (3):209–219. - PubMed
    1. Basser PJ, Pajevic S, Pierpaoli C, Duda J, Aldroubi A. In Vivo Fiber Tractography Using DT-MRI Data. Magnetic Resonance in Medicine. 2000;44 (4):625–632. - PubMed

Publication types

LinkOut - more resources