

Use of density-equalizing cartograms to visualize trends and disparities in state-specific prevalence of obesity: 1996-2006
- PMID: 19059848
- PMCID: PMC2622788
- DOI: 10.2105/AJPH.2008.138750
Use of density-equalizing cartograms to visualize trends and disparities in state-specific prevalence of obesity: 1996-2006
Abstract
Objectives: We used cartograms to visually communicate the state-specific prevalence of obesity and its association with socioeconomic variables over time to benefit and inform decisions by national health policymakers who address geographic and social inequities in health.
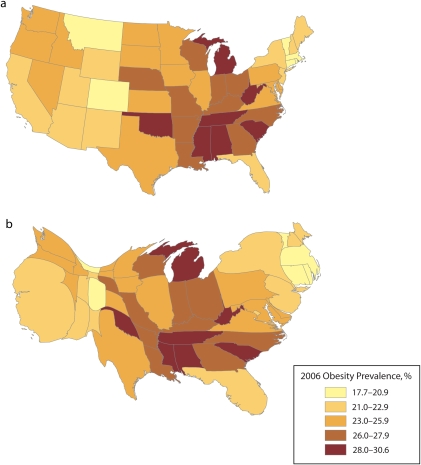
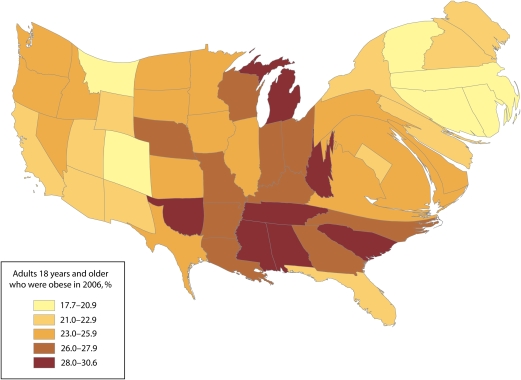
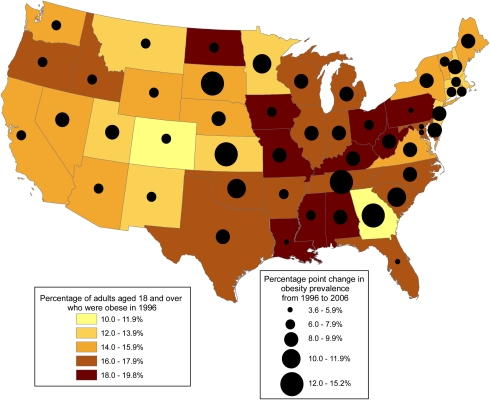
Methods: We generated density-equalizing maps, known as cartograms (in which geographic regions are sized in proportion to some variable), that illustrate indicators of population and educational attainment. We also provide an innovative presentation of the obesity choropleth map (which presents values for areas by shading).
Results: The maps depict the absolute burden of obesity, the inverse association between obesity and education, and geographic patterns in the prevalence of obesity over time.
Conclusions: The prevalence of obesity in the United States continues to increase. These cartograms can help stakeholders interpret surveillance data and their relation to demographic and socioeconomic characteristics to inform decisions.
Figures
References
-
- Ogden CL, Carroll MD, Curtin LR, McDowell MA, Tabak CJ, Flegal KM. Prevalence of overweight and obesity in the United States, 1999–2004. JAMA 2006;295:1549–1555 - PubMed
-
- Centers for Disease Control and Prevention (CDC) State-specific prevalence of obesity among adults—United States, 2005. MMWR Morb Mortal Wkly Rep 2006;55:985–988 - PubMed
-
- Adams PF, Schoenborn CA. Health behaviors of adults: United States, 2002–04. Vital Health Stat 10 2006;230:1–140 - PubMed
-
- Healthy People 2010: Understanding and Improving Health. Washington, DC: US Dept of Health and Human Services; 2000
-
- Ogden CL, Yanowski SZ, Carroll MD, Flegal KM. The epidemiology of obesity. Gastroenterology 2007;132:2087–2102 - PubMed
Publication types
MeSH terms
Grants and funding
LinkOut - more resources
Full Text Sources
Medical
