. 2009 Feb 13;284(7):4667-78.
doi: 10.1074/jbc.M805777200. Epub 2008 Dec 5.

Impaired micro-RNA pathways diminish osteoclast differentiation and function

Affiliations

Impaired micro-RNA pathways diminish osteoclast differentiation and function

Toshifumi Sugatani et al. J Biol Chem. .

Abstract

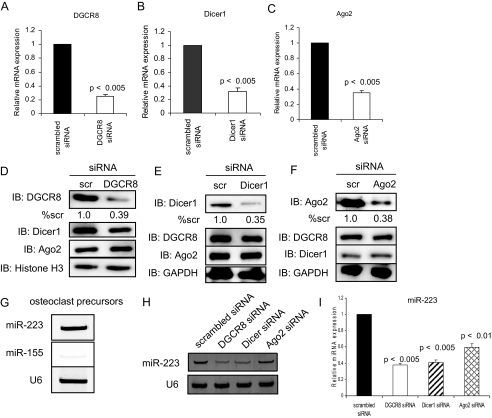
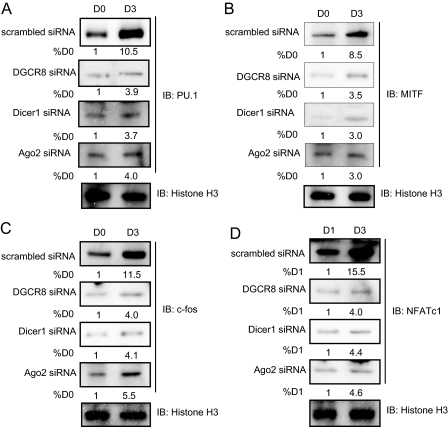
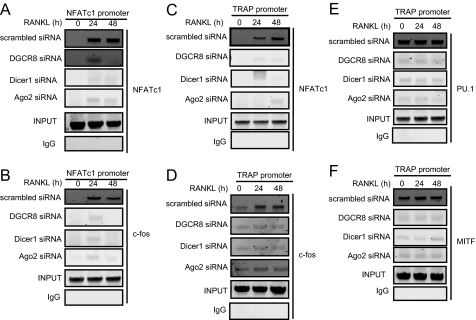
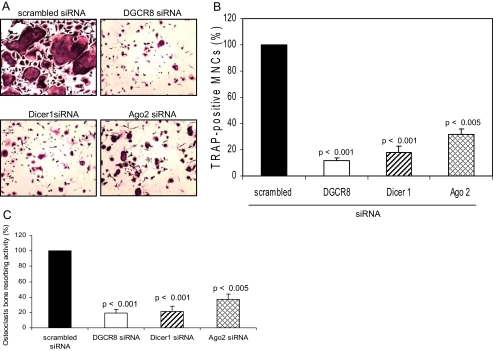
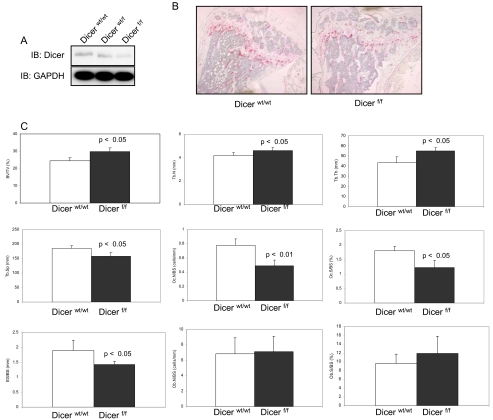
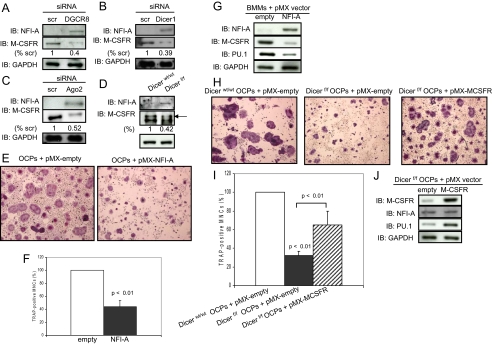
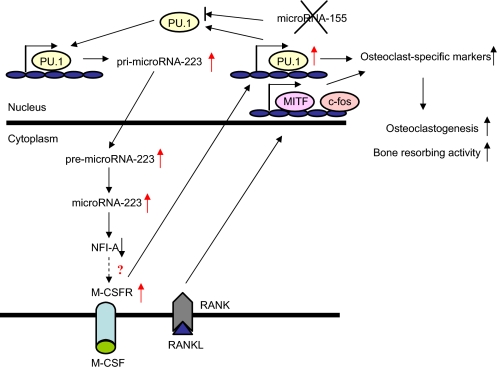
Micro-RNAs (miRNAs) are important in regulating cell fate determination because many of their target mRNA transcripts are engaged in cell proliferation, differentiation, and apoptosis. DGCR8, Dicer, and Ago2 are essential factors for miRNA homeostasis. Here we show that these three factors have critical roles in osteoclast differentiation and function. Gene silencing of DGCR8, Dicer, or Ago2 by small interfering RNA revealed global inhibition of osteoclast transcription factor expression and function, decreased osteoclastogenesis, and decreased bone resorption in vitro. In vivo, CD11b(+)-cre/Dicer-null mice had mild osteopetrosis caused by decreased osteoclast number and bone resorption. These results suggest that miRNAs play important roles in differentiation and function of osteoclasts in vitro and in vivo. We found a novel mechanism mediating these results in which PU.1, miRNA-223, NFI-A, and the macrophage colony-stimulating factor receptor (M-CSFR) are closely linked through a positive feedback loop. PU.1 stimulates miRNA-223 expression, and this up-regulation is implicated in stimulating differentiation and function of osteoclasts through negative regulation of NFI-A levels. Down-regulation of NFI-A levels is important for expression of the M-CSFR, which is critical for osteoclast differentiation and function. NFI-A overexpression decreased osteoclast formation and function with down-regulation of M-CSFR levels. Forced expression of the M-CSFR in M-CSF-dependent bone marrow macrophages from Dicer-deficient mice rescued osteoclast differentiation with up-regulation of PU.1 levels. Our studies provide new molecular mechanisms controlling osteoclast differentiation and function by the miRNA system and specifically by miRNA-223, which regulates NFI-A and the M-CSFR levels.


Figures

FIGURE 1.
FIGURE 1.
Gene silencing and function of DGCR8, Dicer1 or Ago2 in osteoclast precursors. Quantitative real time PCR was performed with primer for mouse DGCR8 (A), Dicer1 (B), or Ago2 (C). The data represent the means ± S.D. of three experiments in triplicate. The loss of DGCR8 (D), Dicer1 (E), or Ago2 (F) protein expression levels by siRNA gene silencing was analyzed by immunoblotting (IB) using nuclear or whole cell extracts. Quantitative image analysis of these protein expression levels was normalized to GAPDH (% scr). scr, scrambled. miRNA RT-PCR (G and H) and quantitative real time RT-PCR (I) were performed to measure miRNA-223 and miRNA-155 expression levels. The PCR products were confirmed using a 20% polyacrylamide gel, with U6 small nuclear RNA as a loading control (G and H). PCR products were normalized to U6 level for each reaction (I). The data represent the means ± S.D. of three experiments in triplicate.
FIGURE 2.
FIGURE 2.
Expression of transcription factors in osteoclast differentiation. Infected cells were treated with RANKL (50 ng/ml) for 3 days, and nuclear extracts were analyzed by immunoblotting with antibodies against PU.1 (A), MITF (B), c-Fos (C), and NFATc1 (D). Quantitative image analysis of the protein expression levels (values below bands) was normalized to histone H3. IB, immunoblotting.
FIGURE 3.
FIGURE 3.
ChIP analysis. Shown are ChIP assays to study the association of NFATc1, c-Fos, PU.1, and MITF with NFATc1 or TRAP promoters during osteoclast differentiation with RANKL (50 ng/ml) stimulation for indicated times.
FIGURE 4.
FIGURE 4.
Expression of osteoclast-specific markers during osteoclastogenesis. Infected cells were treated with RANKL (50 ng/ml) for 3 days. Total RNA was extracted at the indicated time points, and expression of TRAP (A), MMP9 (B), Ctsk (C), CTR (D), and integrin β3 (E) mRNA levels were measured by real time RT-PCR. The PCR products were normalized to GAPDH for each reaction. The data represent the means ± S.D. of three experiments in triplicate.
FIGURE 5.
FIGURE 5.
TRAP-positive osteoclast formation and bone resorbing activity. A and B, infected osteoclast precursors were replated in 24-well plates, and the cells were treated with RANKL (50 ng/ml) and M-CSF conditioned media (1:20). After 5 days, the cells were then fixed and stained for TRAP, and the number of TRAP-positive multinucleated cells was scored. Similar findings were obtained in four independent sets of experiments. C, infected osteoclast precursors were cultured on europium-labeled human collagen-coated bone for 5 days with RANKL stimulation. Osteoclasts bone resorbing activity was measured using each cell culture supernatant by the OsteoLyse™ assay kit. The data represent the means ± S.D. of three experiments in duplicate.
FIGURE 6.
FIGURE 6.
Dicerf/f mice cause mild osteoporosis because of impaired osteoclast formation and activation. A, dicer protein expression levels were analyzed by immunoblotting using whole cell extracts. IB, immunoblotting. B, histological analysis using TRAP stain of femur from three-month-old Dicerwt/wt and Dicerf/f mice. C, histomorphometric analysis. The parameters are measured in the distal femur of 3-month-old Dicerwt/wt and Dicerf/f mice. The data are expressed as the means ± S.D. of five or six mice of each genotype. BV/TV, bone volume; Tb.N, trabecular number; Tb.Th, trabecular thickness; Tb.Sp, trabecular separation; Oc.N/BS, osteoclast number; Oc.S/BS, osteoclast surface; ES/BS, eroded surface; Ob.N/BS, Osteoblast number; Ob.S/BS, osteoblast surface.
FIGURE 7.
FIGURE 7.
A negative effect of NFI-A on M-CSFR expression. A-D, G, and J, NFI-A, M-CSFR, and PU.1 levels in infected-osteoclast precursors and Dicer-null osteoclast precursors were analyzed by immunoblotting using whole cell extracts. Quantitative image analysis of these protein expression levels were normalized to GAPDH. scr, scrambled. IB, immunoblotting. E, F, H, and I, infected osteoclast precursors were replated in 24-well plates, and the cells were treated with RANKL (50 ng/ml) and M-CSF-conditioned medium (1:20). After 5 days, the cells were then fixed and stained for TRAP, and the number of TRAP-positive multinucleated cells was scored. Similar findings were obtained in four independent sets of experiments. OCP, osteoclast precursors.
FIGURE 8.
FIGURE 8.
Inhibition of miRNA-223 expression causes aberrant osteoclastogenesis. A and B, RAW 264.7 cells were transiently transfected with antisense miRNA-223 or negative control oligonucleotides, and the cells were treated with RANKL (100 ng/ml). After 5 days, the cells were then fixed and stained for TRAP, and the number of TRAP-positive multinucleated cells was scored. Similar findings were obtained in four independent sets of experiments. C and D, NFI-A, M-CSFR, and PU.1 levels in RAW264.7 cells with negative control or antisense miRNA-223 and infected osteoclast precursors were analyzed by immunoblotting (IB) using whole cell extracts. Quantitative image analyses of these protein expression levels were normalized to GAPDH. D, The expression levels of miRNA-223 was measured by miRNA Northern blotting using biotin prelabeled probes specific for miRNA-223. Sno234 was used as a loading control. The sno234 normalized fold increase in the miRNA-223 in osteoclast precursors with pMX-PU.1 retroviral vector is shown.
FIGURE 9.
FIGURE 9.
A model of a novel mechanism for controlling osteoclast differentiation and function by miRNA-223 in osteoclast precursors. PU.1 induced by M-CSF activates the transcription of miRNA-223, which causes a negative control on M-CSFR expression levels. Also, induced PU.1 stimulates RANK expression, and consequently osteoclast differentiation and function are induced by M-CSF and RANKL stimulation.

References

    1. Karsenty, G., and Wagner, E. F. (2002) Dev. Cell 2 389-406 - PubMed
    1. Tanaka, S., Nakamura, K., Takahasi, N., and Suda, T. (2005) Immunol. Rev. 208 30-49 - PubMed
    1. Del, F. A., Teti, A., and Rucci, N. (2008) Arch. Biochem. Biophys. 473 147-160 - PubMed
    1. Tondravi, M. M., McKercher, S. R., Anderson, K., Erdmann, J. M., Quiroz, M., Maki, R., and Teitelbaum, S. L. (1997) Nature 386 81-84 - PubMed
    1. Grigoriadis, A. E., Wang, Z. Q., Cecchini, M. G., Hofstetter, W., Felix, R., Fleisch, H. A., and Wagner, E. F. (1994) Science 266 443-448 - PubMed

Publication types

MeSH terms