. 2008 Dec;20(12):3430-47.
doi: 10.1105/tpc.108.061010. Epub 2008 Dec 5.

Characterization of TCTP, the translationally controlled tumor protein, from Arabidopsis thaliana

Affiliations

Characterization of TCTP, the translationally controlled tumor protein, from Arabidopsis thaliana

Oliver Berkowitz et al. Plant Cell. 2008 Dec.

Abstract

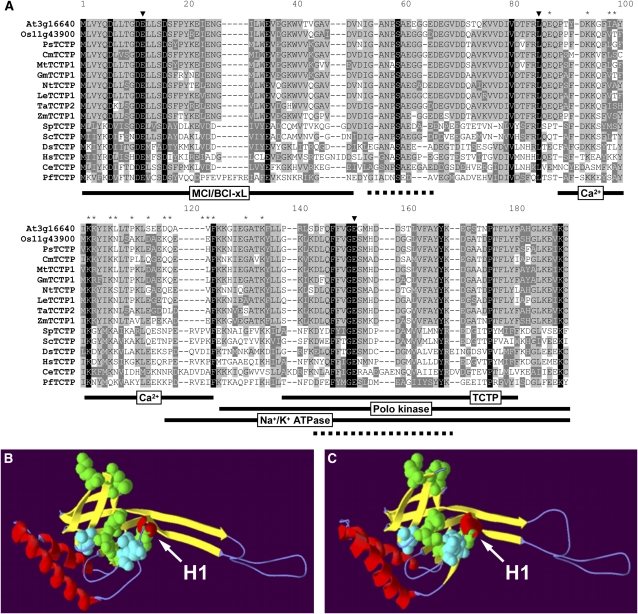
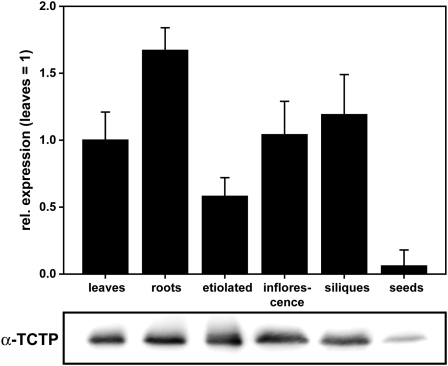
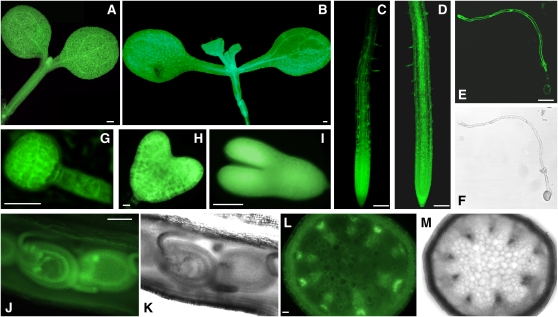
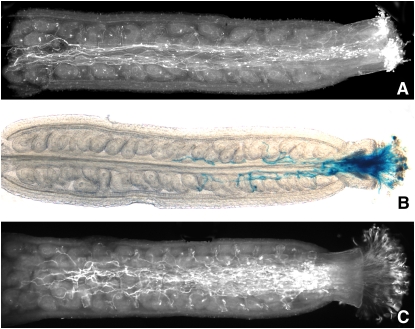
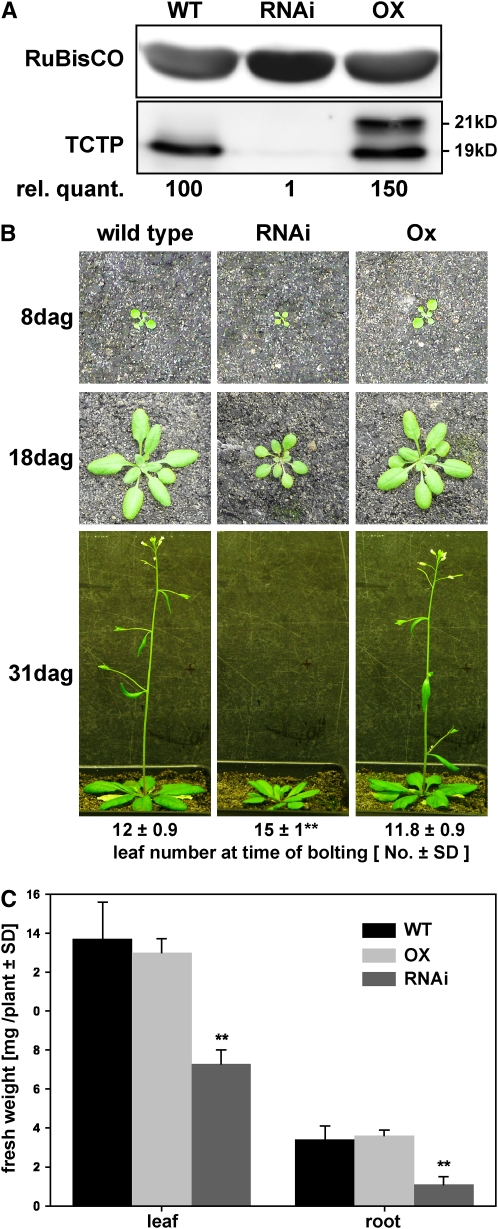
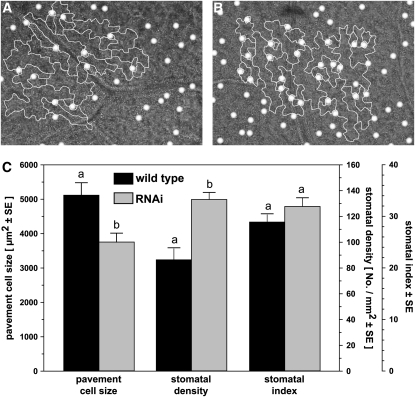
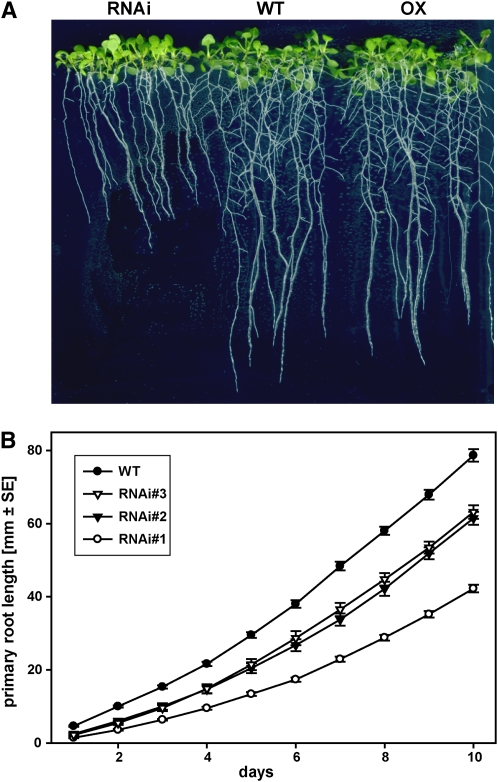
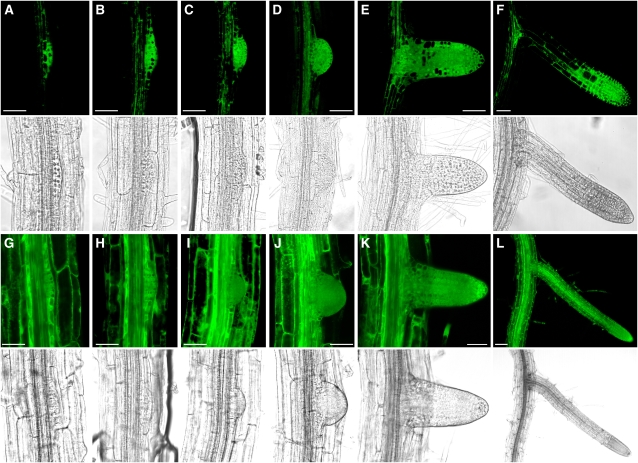
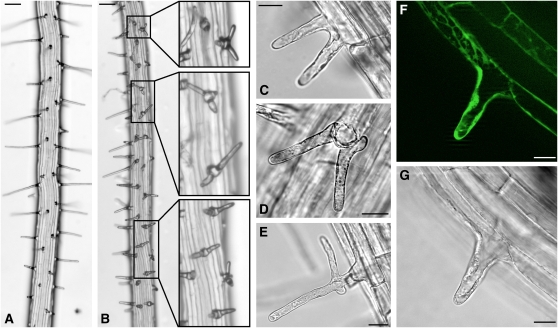
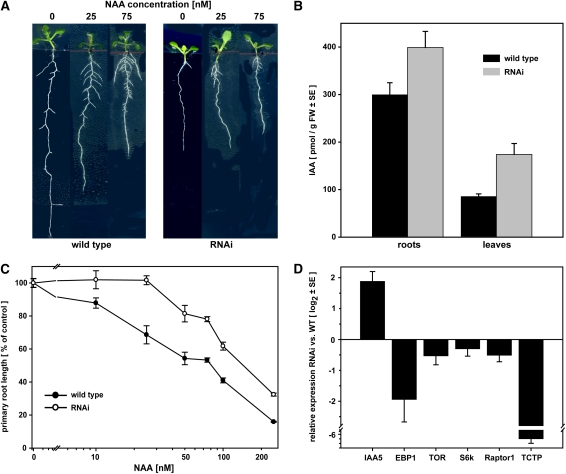
The translationally controlled tumor protein (TCTP) is an important component of the TOR (target of rapamycin) signaling pathway, the major regulator of cell growth in animals and fungi. TCTP acts as the guanine nucleotide exchange factor of the Ras GTPase Rheb that controls TOR activity in Drosophila melanogaster. We therefore examined the role of Arabidopsis thaliana TCTP in planta. Plant TCTPs exhibit distinct sequence differences from nonplant homologs but share the key GTPase binding surface. Green fluorescent protein reporter lines show that Arabidopsis TCTP is expressed throughout plant tissues and developmental stages with increased expression in meristematic and expanding cells. Knockout of TCTP leads to a male gametophytic phenotype with normal pollen formation and germination but impaired pollen tube growth. Silencing of TCTP by RNA interference slows vegetative growth; leaf expansion is reduced because of smaller cell size, lateral root formation is reduced, and root hair development is impaired. Furthermore, these lines show decreased sensitivity to an exogenously applied auxin analog and have elevated levels of endogenous auxin. These results identify TCTP as an important regulator of growth in plants and imply a function of plant TCTP as a mediator of TOR activity similar to that known in nonplant systems.


Figures

Figure 1.
Figure 1.
Sequence Comparison and Structural Modeling of TCTP. (A) The amino acid sequence alignment was performed using the ClustalX1.8b software on representative plant and nonplant sequences (see Supplemental Figure 1 and Supplemental Table 1 online for phylogenetic tree and sequence accessions, respectively). Positions with strictly conserved amino acids are highlighted in black, conserved substitutions in dark gray, and blocks of similar residues in light gray. Triangles and asterisks indicate residues of the Rab GTPase binding triade (Thaw et al., 2001) and the tubulin binding domain (Gachet et al., 1999), respectively. Domains identified for nonplant TCTPs (MCL/BCL-xL interaction, Yang et al., 2005; polo kinase interaction, Yarm, 2002; Na+/K+ ATPase interaction, Jung et al., 2004; Ca2+ binding, Kim et al., 2000; TCTP self interaction, Yoon et al., 2000) are indicated by black lines and the TCTP signature (Interpro accession number IPR001983) by a dotted line. The structure of the Arabidopsis TCTP protein (At3g16640) was modeled using the known structure of the human TCTP (PDB ID 2 hr9, http://www.pdb.org) as a template on the Swiss-Model server (http://swissmodel.expasy.org/; Guex and Peitsch, 1997). (B) and (C) The model obtained for the Arabidopsis protein (B) shows high similarity when compared with the structure of the human protein (C). Most of the absolutely conserved amino acids in all TCTP sequences as identified in the sequence alignment are clustered around the Rab GTPase interaction surface (Thaw et al., 2001) and are shown as calottes. These residues are in green (Met-1, Asp-6, Asp-11, Asp-16, Val-80, and Gly-151) and the core motif in cyan (Glu-12, Leu-85, and Glu-152). The conserved helix (H1) of this region is marked by an arrow. Helices, β-sheets, and coil regions of the two structures are represented in red, yellow, and blue, respectively.
Figure 2.
Figure 2.
Transcript and Protein Expression Analysis. Expression of TCTP was analyzed at the transcript level by qRT-PCR (top panel, mRNA expression levels relative to leaves and first normalized against reference genes, three biological replicates, given as means ± se; see Methods) and on the protein level by immunoblotting with a polyclonal antibody to At3g16640 TCTP protein (bottom panel, 10 μg protein loaded per lane; for TCTP antiserum specificity, see Figure 5). Differences in gene expression levels among tissues (leaves and roots: 2-week-old plants grown in plates; etiolated: grown in plates for 5 d in the dark; inflorescence: fully open flowers stage 12; siliques: fully developed green siliques, seed: mature dry seeds) were below twofold except for mature seeds that had 10-fold lower transcript levels than leaves. Protein levels (same tissues as above) rank according to mRNA levels.
Figure 3.
Figure 3.
TCTP Expression Analysis Using GFP Reporter Lines. TCTP-GFP fusion protein expression under the control of the TCTP promoter in representative transgenic lines carrying the genomic TCTP-GFP construct is visualized by fluorescence imaging. TCTP expression as indicated by GFP fluorescence is ubiquitous throughout tissues and developmental stages. GFP imaging of TCTP reporter lines by epifluorescence microscopy (except for confocal images in [C] and [D]): cotyledons and hypocotyl of a young seedling (A), root (C), germinating pollen ([E] and [F]), embryo ([G], globular stage; [H], heart stage; [I], young embryo), and in cross sections of silique ([J] and [K]) and stem ([L] and [M]). For comparison, images captured for a 35S-GPF line are shown for seedling (B) and root (D). Bars = 100 μm in (A), (B), (J), and (L), 50 μm in (C) to (E) and (I), and 10 μm in (G) and (H).
Figure 4.
Figure 4.
In Vivo Competitiveness Is Reduced in tctp Mutant Pollen. Pollen from heterozygous (TCTP/tctp) SAIL line ([A] and [B]) and RNAi (C) plants was transferred to emasculated wild-type stigma. After 8 h, overall pollen tube growth was revealed by aniline blue staining, whereas germination of tctp mutant pollen (carrying a fusion of the pollen specific LAT52 promoter and the GUS coding sequence on the T-DNA) was specifically highlighted through GUS staining. Wild-type pollen tubes grew to the full length of the ovary and targeted ovules (A). By contrast, few pollen tubes carrying the T-DNA insertion penetrated the stigma and grew far into the ovary and very few targeted ovules (B). Aniline blue staining of pollen from RNAi lines could not reveal any difference to wild-type pollen (C). Pictures show representative images from 1 of 10 stained pistils for each genotype.
Figure 5.
Figure 5.
TCTP Silencing and Overexpression. Protein levels in RNAi lines were reduced to ∼1% of wild-type levels, whereas overexpression under the control of the CaMV 35S promoter led to an increase of ∼50%. TCTP overexpression lines were indistinguishable from the wild type, whereas RNAi lines showed retarded growth throughout development. RNAi lines also displayed significantly delayed bolting when compared with the wild type or overexpression lines, which bolted simultaneously. In parallel, the fresh weight of leaves and roots of in vitro–grown plants was significantly reduced for the silenced lines and again similar between the wild type and overexpressors. (A) Immunodetection of TCTP protein in leaves in wild-type, RNAi, and overexpressing plants. The top panel shows ribulose-1,5-bis-phosphate carboxylase/oxygenase (RuBisCO) detection as loading control. The bottom panel shows detection of the endogenous Arabidopsis TCTP at 19 kD and the overexpressed TCTP carrying a fusion tag at 21 kD. Numbers below the immunoblot give TCTP protein levels relative to the wild type, quantified from band intensities of a representative immunoblot from three replicates. (B) Images of representative plants for each genotype (the wild type, OX line #1, and RNAi line #1) 8, 18, and 31 d after germination (dag), respectively. Numbers below the frame give the average leaf number with sd at the time of bolting (n = 8). (C) Fresh weights of in vitro–grown wild type, RNAi#1, and OX#1 lines 10 d after germination (means ± sd, five biological replicates of at least 15 pooled seedlings). Asterisks indicate statistically significant differences (analysis of variance [ANOVA] test, P < 0.001). [See online article for color version of this figure.]
Figure 6.
Figure 6.
Silencing of TCTP Reduces Pavement Cell Size. Comparison of pavement cells in the wild type and RNAi line #1 revealed that silencing of TCTP leads to a reduction in cell size of ∼25%. Stomatal density for the RNAi line was increased by 35%, but the slight increase in the stomatal index (SI) calculated from epidermal cell (E) and stomata (S) numbers per unit leaf area [SI = S*100/(S+E)] was not significant. (A) and (B) Representative images of leaf abaxial epidermis for wild-type (A) and RNAi lines (B) with outlines of pavement cells and position of stomata highlighted. (C) Quantification of cell size, stomatal density, and stomatal index determined for both genotypes from six independent areas per leaf and 30 cells measured within each. “a” and “b” indicate statistically significant changes (ANOVA test on raw data, P < 0.05)
Figure 7.
Figure 7.
Effect of Altered TCTP Expression on Growth and Root Development. RNAi lines showed retarded growth of the primary root, whereas overexpressors and wild-type plants were not visually different. RNAi lines developed fewer lateral roots (see Table 3 for quantitative data). Comparison of the three most severely silenced lines showed a quantitative effect of TCTP silencing on root growth with RNAi#1 having the slowest growing primary root. [See online article for color version of this figure.] (A) Representative image of wild-type, TCTP RNAi, and TCTP overexpressing seedlings (line RNAi#1 and OX#1, respectively) grown on agar in vertical plates. (B) Time course of primary root growth for three RNAi lines and the wild type (given as means ± se, n > 12 for each genotype).
Figure 8.
Figure 8.
GFP Fluorescence during Lateral Root Formation in TCTP-GFP Reporter Lines. Confocal laser scanning microscopy of lateral root formation in TCTP-GFP reporter lines ([A] to [F]) in comparison to a 35S-GFP control line ([G] to [L]). GFP fluorescence for the TCTP line becomes visible early in root primordia initiation when first cell divisions occur in the pericycle and then remains strong in the actively dividing tissue layers. For the 35S-GFP control line, fluorescence in the lateral root primordia is comparable to surrounding tissues and is detectable throughout the developing lateral root. Top panels in (A) to (L) show GFP fluorescence; bottom panels correspond to transmission images. Bars = 50 μm. (A), (B), (G), and (H) Lateral root initiation after early cell divisions in the pericycle. (C) and (I) Later stage of lateral root primordium development, penetration of endodermal layer. (D) and (J) Primordium reaches the epidermis. (E) and (K) Lateral root after emergence. (F) and (L) later stages of lateral root formation.
Figure 9.
Figure 9.
Root Hair Development in RNAi Lines Is Impaired and Depolarized. Shown are images for RNAi line #1, which showed the most severely impaired root hair development. Root hairs exhibited altered phenotypes in patches along the root axes ([B], insets show magnifications) when compared with the wild type (A). Frequently, root hairs branched from the flanks of a central bulge ([C], side view; [D], view from the top). In some cases, root hairs were depolarized with additional tips growing from the base (E). GFP fluorescence in the TCTP-GFP reporter lines was readily observable in root hair cells ([F], GFP fluorescence; [G], transmission image, confocal images). Bars = 100 μm in (A) and (B) and 20 μm in (C) to (G). [See online article for color version of this figure.]
Figure 10.
Figure 10.
TCTP-RNAi Lines Have an Altered Auxin Homeostasis. Treatment with increasing concentrations of NAA revealed an auxin-resistant phenotype of RNAi lines. Primary root elongation in these lines showed no response at concentrations of up to 25 nM NAA and at higher concentrations a consistently lower response than the wild type. Quantification of endogenous free IAA levels revealed increased levels in RNAi plants compared with the wild type and a constitutively higher expression of the auxin-inducible transcriptional regulator IAA5. Expression of EBP1 was reduced by approximately fourfold in the RNAi lines, and there was no significant change in the expression of other genes of the TOR pathway. [See online article for color version of this figure.] (A) Representative images of wild-type and RNAi (RNAi#1 line) plants grown in vitro on half-strength Murashige and Skoog (MS) medium supplemented with NAA. (B) Relative primary root length after 5 d of growth on supplemented medium (mean ± se, n = 9). (C) Quantification of free IAA levels in RNAi and wild-type plants (mean ± se of seven biological replicates). Increases in RNAi plants are statistically significant (ANOVA test, P < 0.05). (D) Expression analysis by qRT-PCR for IAA5, EBP1, TOR, S6k, Raptor1, and TCTP in leaf tissue. Relative expression (mean ± se) was normalized to three reference genes (APT1, PDF2, and UBC9; see Methods).

Similar articles

Cited by

References

    1. Anderson, G.H., Veit, B., and Hanson, M.R. (2005). The Arabidopsis AtRaptor genes are essential for post-embryonic plant growth. BMC Biol. 3 12. - PMC - PubMed
    1. Aoki, K., Suzui, N., Fujimaki, S., Dohmae, N., Yonekura-Sakakibara, K., Fujiwara, T., Hayashi, H., Yamaya, T., and Sakakibara, H. (2005). Destination-selective long-distance movement of phloem proteins. Plant Cell 17 1801–1814. - PMC - PubMed
    1. Arthur, K.M., Vejlupkova, Z., Meeley, R.B., and Fowler, J.E. (2003). Maize ROP2 GTPase provides a competitive advantage to the male gametophyte. Genetics 165 2137–2151. - PMC - PubMed
    1. Bai, X., Ma, D., Liu, A., Shen, X., Wang, Q.J., Liu, Y., and Jiang, Y. (2007). Rheb activates mTOR by antagonizing its endogenous inhibitor, FKBP38. Science 318 977–980. - PubMed
    1. Baluska, F., Salaj, J., Mathur, J., Braun, M., Jasper, F., Samaj, J., Chua, N.H., Barlow, P.W., and Volkmann, D. (2000). Root hair formation: F-actin-dependent tip growth is initiated by local assembly of profilin-supported F-actin meshworks accumulated within expansin-enriched bulges. Dev. Biol. 227 618–632. - PubMed

Publication types

MeSH terms

Substances