. 2008 Dec 9;105(49):19120-5.
doi: 10.1073/pnas.0801725105. Epub 2008 Dec 5.

Individual movement behavior, matrix heterogeneity, and the dynamics of spatially structured populations

Affiliations

Individual movement behavior, matrix heterogeneity, and the dynamics of spatially structured populations

Eloy Revilla et al. Proc Natl Acad Sci U S A. .

Abstract

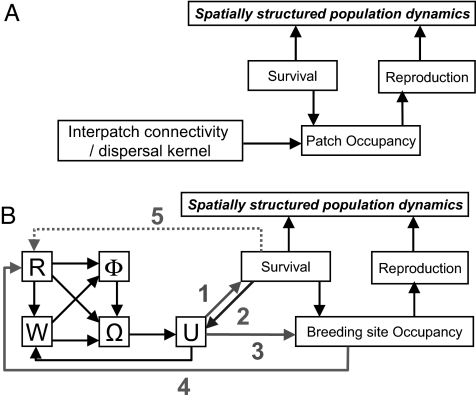
The dynamics of spatially structured populations is characterized by within- and between-patch processes. The available theory describes the latter with simple distance-dependent functions that depend on landscape properties such as interpatch distance or patch size. Despite its potential role, we lack a good mechanistic understanding of how the movement of individuals between patches affects the dynamics of these populations. We used the theoretical framework provided by movement ecology to make a direct representation of the processes determining how individuals connect local populations in a spatially structured population of Iberian lynx. Interpatch processes depended on the heterogeneity of the matrix where patches are embedded and the parameters defining individual movement behavior. They were also very sensitive to the dynamic demographic variables limiting the time moving, the within-patch dynamics of available settlement sites (both spatiotemporally heterogeneous) and the response of individuals to the perceived risk while moving. These context-dependent dynamic factors are an inherent part of the movement process, producing connectivities and dispersal kernels whose variability is affected by other demographic processes. Mechanistic representations of interpatch movements, such as the one provided by the movement-ecology framework, permit the dynamic interaction of birth-death processes and individual movement behavior, thus improving our understanding of stochastic spatially structured populations.


Conflict of interest statement

The authors declare no conflict of interest.

Figures

Fig. 1.
Fig. 1.
Schematic representation of the processes involved in the dynamics of spatially structured populations. (A) Patch-centered view where survival and reproduction are considered as local processes. Between-patch processes (namely movement) are represented by a matrix of interpatch connectivities, commonly based on distance kernels (different survival regimes during interpatch processes act as modifiers of the complete kernel). (B) Individual centered representation, including the movement process of dispersing individuals in search of empty breeding sites (natal dispersal) as described within the movement-ecology framework. W, the internal state of the individuals motivating the movement; Ω, motion capacity; Φ, navigation capacity; R, external environmental conditions that can affect the internal state and the navigation and motion capacities; U, actual movement path followed by the individual. Numbered arrows represent the dynamic interaction of movement with demographic processes. Arrow 1, the actual path affects the survival (spatially heterogeneous, e.g., inside and outside a reserve); arrow 2, the actual survival of moving individuals affects the time moving and hence the length of the path; arrow 3, moving individuals settle in empty breeding sites, thus dynamically modifying the pattern of empty sites (which are dynamically generated); arrow 4, the pattern of empty sites is an external environmental modifier of the movement (potential targets); arrow 5, individuals perceive and respond to a differential risk of mortality associated with the presence of a fragmented matrix (the perceived risk depends on animal's position).
Fig. 2.
Fig. 2.
Sensitivity analysis of the effect of simulation parameters on yearly per capita emigration (E) and immigration (I) rates for each local population. Populations 1 and 2 (pop1 and pop2) are sources located inside a reserve; the rest are sinks. To compare the relative impact of the different simulation parameters on E and I, we obtained the standardized parameter estimates for E (black bars) and I (gray bars) from a statistical description using the parameters of the simulation model as independent variables. We excluded poor statistical models (adj r2 < 0.4, corresponding with population 3, and E from sinks; for all of the plots 0.41〈adj r2 < 0.75). We show only significant parameter estimates. Motion parameters: f(α), average number of steps per day; θd, autocorrelation in dispersal habitat; L, long-distance displacement threshold; Δθl, increase in autocorrelation in long-distance displacements; δ, bimodal distribution of turning angles. Navigation (Navig.): Nd, fragmentation threshold; Δθf, increase in autocorrelation in fragmented areas; β, avoidance of open habitat; γ, probability to return to dispersal habitat. Reproduction (Rep.): bn, probability of reproduction; Δbn, increase in reproduction probability. Mortality: MrIR, mortality of residents inside the reserve; MrOR, mortality of residents outside the reserve; McIR, mortality of cubs inside the reserve; McOR, mortality of cubs outside the reserve; MsIR, mortality of subadults inside the reserve; MsOR, mortality of subadults outside the reserve; MdIR, mortality of dispersers inside the reserve; MdOR, mortality of dispersers outside the reserve.
Fig. 3.
Fig. 3.
Extinction probability in 100 years for landscapes with different levels of matrix heterogeneity. We considered the current landscape configuration (Top), a distribution of dispersal habitat buffering breeding habitat (Middle), and a random distribution of dispersal habitat (Bottom). In all cases, we only changed the proportion of dispersal/open habitats. The three maps show an example for each landscape configuration (dark gray represents breeding habitat, light gray barrier—the lower left corner is the Atlantic ocean—, intermediate gray dispersal habitat and white open habitat). We used three scenarios depending on the increase of risk of mortality during dispersal when individuals move in more fragmented areas (circles, no effect ρ = 0; squares, field estimate of the risk increase ρ = 5.8; triangles, ρ = 10; see The Movement Submodel and Model Parameterization in SI Appendix). In the three cases, the baseline mortality during dispersal was adjusted. The vertical gray line marks the proportion of dispersal habitat present in the current real landscape. Symbols are the average extinction probabilities for five landscape replicates (±SD). The three horizontal gray lines represent the extinction probabilities in the current landscape for the three risk scenarios.
Fig. 4.
Fig. 4.
Variations in the yearly per capita emigration (E, black bars) and immigration (I, gray bars) rates for each local population (pop1 to pop7) in different matrix configurations. The bars represent the difference Δ between the average value (and coefficient of variation) of E and I for the current landscape (see Fig. S1) and the values estimated for each configuration. The configurations are Corridors: a linear corridor (4 cells of dispersal habitat wide) connecting each subpopulation to its closest neighbor; Dispersal habitat: all of the matrix (except for barriers) covered by dispersal habitat; Open habitat: all of the matrix (except for barriers) covered by open habitat; 34% buffer: 34% of the matrix composed by dispersal habitat located buffering breeding habitat (see Fig. 3); 34% random: 34% of the matrix composed by dispersal habitat located randomly (see Fig. 3).

References

    1. Hanski I. Metapopulation dynamics. Nature. 1998;396:41–49.
    1. Hanski I, Ovaskainen O. The metapopulation capacity of a fragmented landscape. Nature. 2000;404:755–758. - PubMed
    1. Pulliam HR. Sources, sinks, and population regulation. Am Nat. 1988;132:652–661.
    1. Thomas CD, Kunin WE. The spatial structure of populations. J Anim Ecol. 1999;68:647–657.
    1. Bowler DE, Benton TG. Causes and consequences of animal dispersal strategies: Relating individual behaviour to spatial dynamics. Biol Rev. 2005;80:205–225. - PubMed

Publication types

LinkOut - more resources