. 2008 Dec 16;105(50):20038-43.
doi: 10.1073/pnas.0807551105. Epub 2008 Dec 5.

The photoreversible fluorescent protein iLOV outperforms GFP as a reporter of plant virus infection

Affiliations

The photoreversible fluorescent protein iLOV outperforms GFP as a reporter of plant virus infection

Sean Chapman et al. Proc Natl Acad Sci U S A. .

Abstract

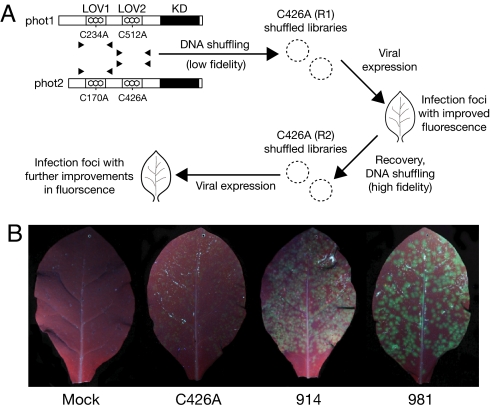
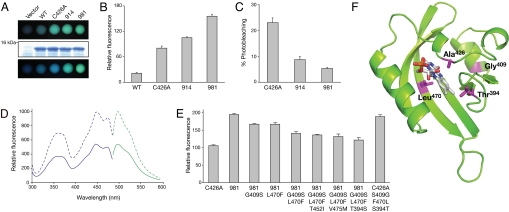
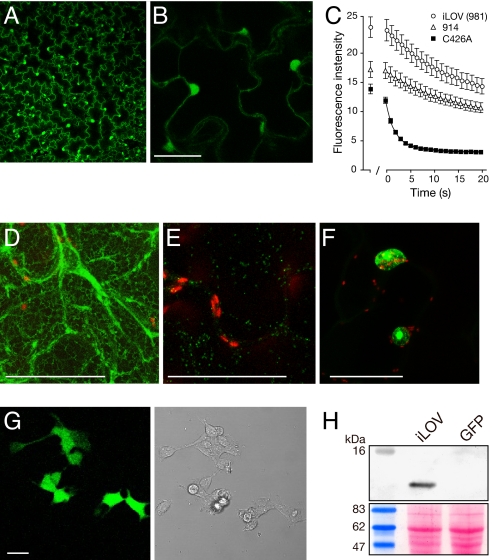
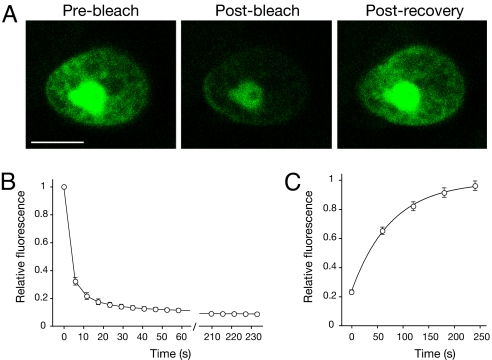
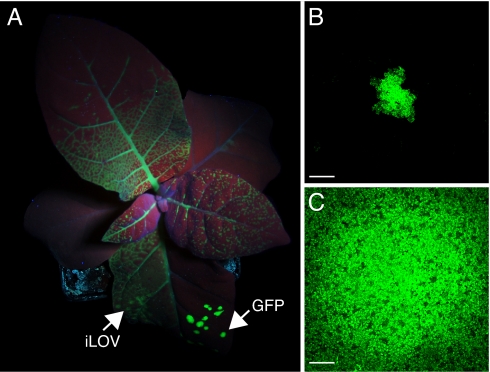
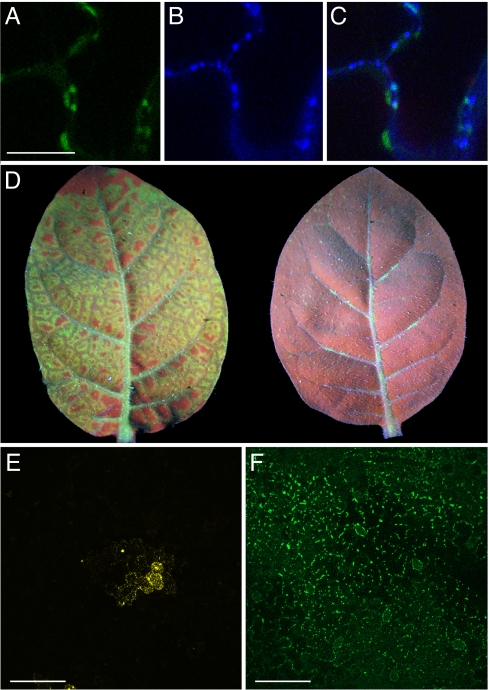
Fluorescent proteins (FPs) based on green fluorescent protein (GFP) are widely used throughout cell biology to study protein dynamics, and have extensive use as reporters of virus infection and spread. However, FP-tagging of viruses is limited by the constraints of viral genome size resulting in FP loss through recombination events. To overcome this, we have engineered a smaller ( approximately 10 kDa) flavin-based alternative to GFP ( approximately 25 kDa) derived from the light, oxygen or voltage-sensing (LOV) domain of the plant blue light receptor, phototropin. Molecular evolution and Tobacco mosaic virus (TMV)-based expression screening produced LOV variants with improved fluorescence and photostability in planta. One variant in particular, designated iLOV, possessed photophysical properties that made it ideally suited as a reporter of subcellular protein localization in both plant and mammalian cells. Moreover, iLOV fluorescence was found to recover spontaneously after photobleaching and displayed an intrinsic photochemistry conferring advantages over GFP-based FPs. When expressed either as a cytosolic protein or as a viral protein fusion, iLOV functioned as a superior reporter to GFP for monitoring local and systemic infections of plant RNA viruses. iLOV, therefore, offers greater utility in FP-tagging of viral gene products and represents a viable alternative where functional protein expression is limited by steric constraints or genome size.


Conflict of interest statement

The authors declare no conflict of interest.

Figures

Fig. 1.
Fig. 1.
DNA shuffling of phototropin LOV domains. (A) Schematic representation of the shuffling procedure. Arabidopsis phot1 and phot2 consist of a C-terminal serine/threonine kinase domain (KD) and two photosensory LOV domains (LOV1 and LOV2) that bind the chromophore FMN. The conserved cysteine required for LOV-domain photochemistry was replaced with alanine by site-directed mutagenesis before DNA shuffling. Two sequential rounds of DNA shuffling were carried out (R1 and R2, respectively). In R1, shuffled populations were generated by using low fidelity PCR conditions. For R2, high fidelity PCR conditions were used. In each case, the LOV2 domain of Arabidopsis phot2 (C426A) was used as a template scaffold for reassembly. Shuffled populations were subjected to TMV-based expression in tobacco and screened for improved fluorescence under UV light. (B) TMV-based expression of LOV variants in leaves of Nicotiana tabacum. Images were recorded simultaneously under UV illumination to allow direct comparison of green fluorescence. Leaves were either mock inoculated or inoculated with TMV vector expressing the progenitor C426A or the brightest variants from R1 and R2 (914 and 981, respectively) and photographed 3 days post inoculation.
Fig. 2.
Fig. 2.
Photochemical characterization of shuffled LOV variants expressed in E. coli. (A) In vivo fluorescence in E. coli liquid cultures expressing wild-type Arabidopsis phot2 LOV2 (WT), derivative C426A and shuffled variants 914 and 981 viewed immediately under UV light (Top) or after several minutes of UV irradiation (Bottom). Equal protein levels in E. coli cultures are shown by SDS/PAGE and Coomassie Blue staining using cells transformed with the expression vector only as a control (Middle). (B) Quantification of LOV-mediated in vivo fluorescence in E. coli liquid cultures. Fluorescence intensities of liquid cultures were recorded at 495 nm upon excitation with blue light (450 nm). (C) Fluorescence loss in LOV-expressing E. coli cultures after xenon arc lamp illumination. Fluorescence intensities were recorded as in (B). (D) Fluorescence excitation and emission spectra of purified C426A (solid line) and variant 981 (dashed line). Fluorescence excitation spectra (blue) were recorded by using an emission wavelength of 495 nm, whereas fluorescence emission spectra (green) were recorded by using an excitation wavelength of 450 nm. (E) Reverse mutagenesis and quantification of 981-mediated in vivo fluorescence in E. coli liquid cultures. Point mutations indicated were introduced into 981 and the effect on in vivo fluorescence was assessed as in (B). Selective point mutations were then introduced into the progenitor C426A to confirm their role in enhancing fluorescence emission. (F) Structure of 981 was obtained by homology modeling with the program Swiss Model using the protein structure of Adiantum-capillus-veneris neochrome LOV2 (PDB entry IG28) and visualized by using PyMOL. Amino acid residues contributing to the enhanced fluorescence of 981 are indicated in magenta.
Fig. 3.
Fig. 3.
Expression and subcellular targeting of iLOV in Nicotiana benthamiana and HEK cells. (A) Virus-based expression of free iLOV from a TMV vector. (B) Higher magnification of free iLOV expression showing both cytosolic and nuclear localization. (Scale bar, 50 μm.) (C) Photobleaching kinetics of LOV variants expressed in epidermal cells. LOV-mediated fluorescence from nuclei was used to quantify fluorescence loss in response to repeated scanning at 40% laser power. The first scan was used to focus on nuclei to be imaged and quantified. After 1 min, a series of 20 images was collected every s. Values represent the mean ± SE (n = 21). (D) iLOV targeted to the endoplasmic reticulum with TMV.SP-iLOV-HDEL. (Scale bar, 50 μm.) (E) iLOV targeted to the Golgi from TMV.ST-iLOV (indicated in green). Chloroplast autofluorescence is indicated in red. (Scale bar, 50 μm.) (F) iLOV expressed as a C-terminal fusion to Arabidopsis histone 2B. (Scale bar, 50 μm.) (G) Fluorescence imaging of free iLOV expressed in HEK cells. Bright field image is shown on the right. (Scale bar, 20 μm.) (H) iLOV accumulation in HEK cells detected by Western blotting using anti-iLOV antibody. HEK cells expressing GFP were used as a control. Ponceau S staining of the immunoblot below shows equal protein loading (20 μg).
Fig. 4.
Fig. 4.
Recovery of iLOV fluorescence after photobleaching. (A) iLOV expressed as a C-terminal fusion to Arabidopsis histone 2B was used to quantify fluorescence recovery after photobleaching. Representative images before photobleaching, after bleaching and post recovery are shown. (Scale bar, 5 μm.) (B) Photobleaching kinetics of nuclear-localized iLOV after repeated laser scanning at 88% laser power. A series of 40 scans was performed and one image collected every 6 s. Values represent the mean ± SE (n = 18). (C) Recovery kinetics for iLOV fluorescence after photobleaching. Values represent the mean ± SE (n = 18). Recovery fits to a first exponential and indicates a half-maximal recovery time of 54 s.
Fig. 5.
Fig. 5.
Utility of iLOV as a cytosolic fluorescent reporter for TMV infection. (A) Half-leaf inoculations of Nicotiana tabacum show that systemic spread of TMV.iLOV is extensive 4 days post inoculation (dpi) whereas TMV.GFP is still restricted to primary lesions on the inoculated leaf. Arrows indicate half-leaf inoculation sites. (B) Size of TMV.GFP lesion at 2 dpi. (Scale bar, 500 μm.) Lesions typically measured 687 μm ± 103 (n = 14). (C) Size of TMV.iLOV lesion at 2 dpi. (Scale bar, 500 μm.) Lesions typically measured over 3045 μm ± 113 (n = 8).
Fig. 6.
Fig. 6.
Utility of iLOV as a fluorescent reporter fusion for TMV and PMTV infection. (A) TMV MP-iLOV localization to plasmodesmata. (Scale bar, 20 μm.) (B) Callose staining at plasmodesmata with aniline blue. (C) Colocalization of TMV MP-iLOV fluorescence with aniline blue staining of plasmodesmata. (D) Systemic spread of TMV MP-iLOV and TMV MP-GFP. Upper leaves of Nicotiana tabacum at 4 days post inoculation. TMV MP-iLOV shows extensive systemic spread and unloads from all major vein classes, spreading into neighboring ground tissue (left). TMV MP-GFP by comparison shows no or limited systemic spread unloading only patchily from the midrib and some secondary veins. Leaves were photographed simultaneously to allow direct comparison of green fluorescence intensity. (E) Representative image showing the lesions size produced by PMTV expressing CPRT-YFP 2 days post bombardment of Nicotiana tabacum leaves. (Scale bar, 100 μm.) (F) Lesion size for PMTV expressing CPRT-iLOV visualized as in (E). (Scale bar, 100 μm.)

References

    1. Shaner NC, Patterson GH, Davidson MW. Advances in fluorescent protein technology. J Cell Sci. 2007;120:4247–4260. - PubMed
    1. Baulcombe DC, Chapman S, Santa Cruz S. Jellyfish green fluorescent protein as a reporter for virus infections. Plant J. 1995;7:1045–1053. - PubMed
    1. Oparka KJ, Prior DA, Santa Cruz S, Padgett HS, Beachy RN. Gating of epidermal plasmodesmata is restricted to the leading edge of expanding infection sites of tobacco mosaic virus (TMV) Plant J. 1997;12:781–789. - PubMed
    1. Rabindran S, Dawson WO. Assessment of recombinants that arise from the use of a TMV-based transient expression vector. Virology. 2001;284:182–189. - PubMed
    1. Lacomme C, Pogue GP, Wilson TMA, Santa Cruz S. Plant viruses as gene expression vectors. In: Ring CJA, Blair ED, editors. Genetically Engineered Viruses: Development and Applications. Oxford: BIOS Scientific Publishers Ltd; 2001. pp. 59–105.

Publication types

MeSH terms