. 2008 Dec 16;105(50):19998-20003.
doi: 10.1073/pnas.0808312105. Epub 2008 Dec 5.

Rods-cones and melanopsin detect light and dark to modulate sleep independent of image formation

Affiliations

Rods-cones and melanopsin detect light and dark to modulate sleep independent of image formation

C M Altimus et al. Proc Natl Acad Sci U S A. .

Abstract

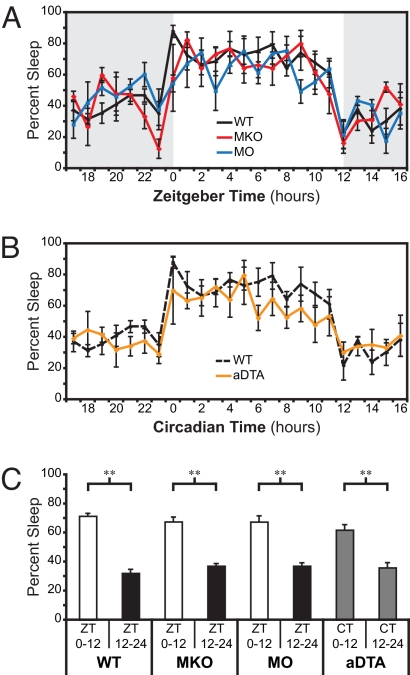
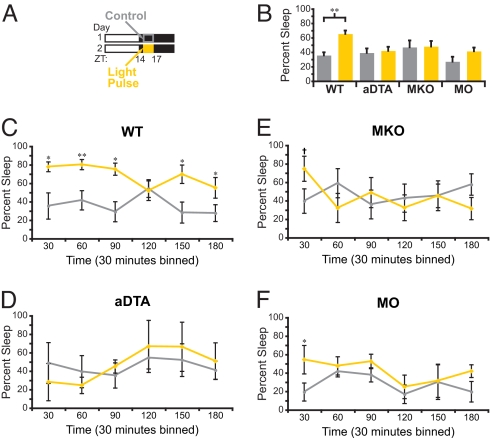
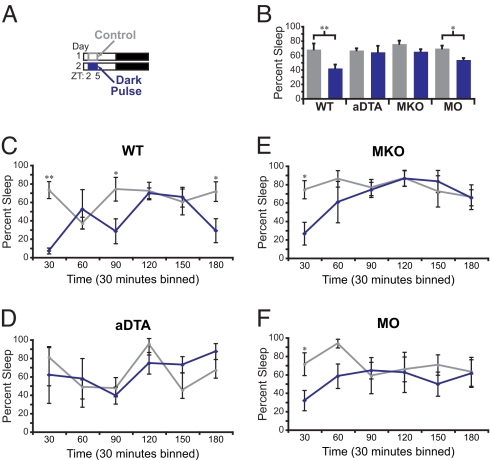
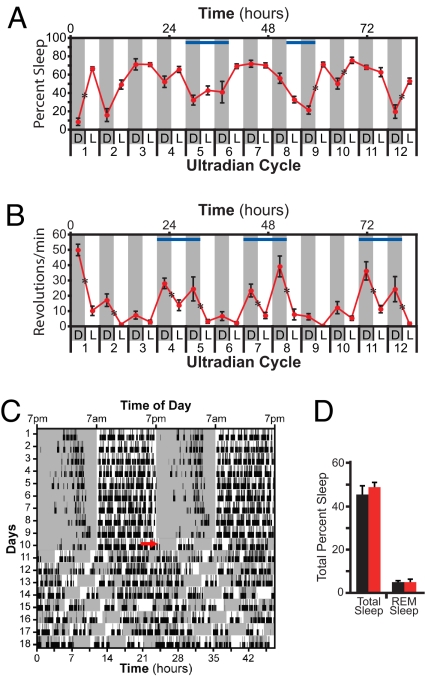
Light detected in the retina modulates several physiological processes including circadian photo-entrainment and pupillary light reflex. Intrinsically photosensitive retinal ganglion cells (ipRGCs) convey rod-cone and melanopsin-driven light input to the brain. Using EEGs and electromyograms, we show that acute light induces sleep in mice during their nocturnal active phase whereas acute dark awakens mice during their diurnal sleep phase. We used retinal mutant mouse lines that lack (i) the ipRGCs, (ii) the photo-transduction pathways of rods and cones, or (iii) the melanopsin protein and showed that the influence of light and dark on sleep requires both rod-cone and melanopsin signaling through ipRGCs and is independent of image formation. We further show that, although acute light pulses overcome circadian and homeostatic drives for sleep, upon repeated light exposures using a 3.5 h/3.5 h light/dark cycle, the circadian and homeostatic drives override the light input. Thus, in addition to their known role in aligning circadian physiology with day and night, ipRGCs also relay light and dark information from both rod-cone and melanopsin-based pathways to modulate sleep and wakefulness.


Conflict of interest statement

The authors declare no conflict of interest.

Figures

Fig. 1.
Fig. 1.
Rod-cone and melanopsin photoreception entrain sleep rhythms through ipRGCs (A) The percent of time the mice spend sleeping (NREM and REM summed/total time for percentage of sleep) is plotted against the daily time defined as zeitgeber “time-giver” time (ZT). Data binned into 1-hour intervals. WT (n = 5, black), MKO (n = 4, red), and MO (n = 4, blue) mice are all able to confine sleep to the light portion of a 12 h/12 h LD cycle. Gray background indicates lights off; white background indicates lights on. (B) Percent sleep in four aDTA mice (orange) aligned and plotted against circadian time as defined by the start of the sleep phase (CT0). WT from A is plotted for reference (dashed black). (C) Percent sleep in light and dark portions of the day in WT, MKO, and MO animals shows that all three genotypes are able to confine their sleep to the light portion of the day. The aDTA mice are plotted with CT time to show that they segregate sleep and wake to separate portions of the day (**, P < 0.01). All points represent mean ± SEM.
Fig. 2.
Fig. 2.
Rod-cone and melanopsin photoreception are necessary to sustain induction of sleep by a light pulse (A) A diagram of light paradigm used in B–F. Gray outline demarcates the control period of baseline night and orange box indicates the time of light presentation. For B–F, gray represents the data from control night and yellow represents the data from the light pulse. (B) Changes in total sleep during the light pulse in WT (n = 5), aDTA (n = 3), MKO (n = 5), and MO (n = 4) mice. A significant increase in sleep was observed in only WT animals. (C–F) Data from B subdivided in 30-min bins. (C) WT animals show a sustained sleep induction. (D) aDTA mice do not show any induction of sleep by a light pulse. (E and F) MKO and MO animals show a transient induction of sleep at the beginning of the light pulse (*, P < 0.05; **, P < 0.01; and +, P < 0.05, Student's t test of 30-min bin only). All points represent mean ± SEM.
Fig. 3.
Fig. 3.
A dark pulse induces wakefulness through ipRGCs (A) A diagram of dark exposure used in B–F. Gray outline demarcates the control period of baseline day and the blue box indicates the time of dark presentation. For all panels in B–F, gray represents the data from control day and blue represents the data from the dark pulse. (B) Changes in total sleep during the dark pulse in WT (n = 5), aDTA (n = 3), MKO (n = 4), and MO (n = 4) mice. A significant increase in wakefulness by a dark pulse was observed in WT and MO animals. (C–F) Data from B subdivided in 30-min bins. WT (C), MKO (E), and MO (F) all show a transient induction of wake, whereas aDTA (D) mice do not respond to the dark presentation (*, P < 0.05; **, P < 0.01). All points represent mean ± SEM.
Fig. 4.
Fig. 4.
Chronic light pulses repeatedly inhibit wheel-running activity but are not able to consistently induce sleep. (A and B) WT mice housed under 3.5 h/3.5 h LD ultradian cycles (light, white background; dark, gray background) reveal that light does not consistently induce sleep (A) (n = 4) but does consistently inhibit wheel running activity measured in a second group of animals (B) (n = 10). Lower x axis indicates cycle number and lighting condition. Upper axis depicts hours from the start of cycle 1. Blue bars indicate approximate region of wake maintenance zones in A and phases where the circadian drive to be active is high in B. (C) A representative double plotted diagram of sleep activity for one mouse in 12 h/12 h LD (circadian, d 1–10) and ultradian (d 11–18) paradigms (white background, light; gray background, darkness). Black tick marks represent sleep, and REM sleep is denoted by higher ticks. Red arrow shows the start of the first ultradian cycle. (D) Levels of total sleep and REM sleep are similar between 12/12 LD (black) and ultradian (red) light cycles (n = 3). *, P < 0.05.

References

    1. Borbely AA. A two process model of sleep regulation. Hum Neurobiol. 1982;1:195–204. - PubMed
    1. Dijk DJ, Czeisler CA. Paradoxical timing of the circadian rhythm of sleep propensity serves to consolidate sleep and wakefulness in humans. Neurosci Lett. 1994;166:63–68. - PubMed
    1. Czeisler CA, et al. Bright light induction of strong (type 0) resetting of the human circadian pacemaker. Science. 1989;244:1328–1333. - PubMed
    1. Lockley SW, et al. Short-wavelength sensitivity for the direct effects of light on alertness, vigilance, and the waking electroencephalogram in humans. Sleep. 2006;29:161–168. - PubMed
    1. Benca RM, Gilliland MA, Obermeyer WH. Effects of lighting conditions on sleep and wakefulness in albino Lewis and pigmented Brown Norway rats. Sleep. 1998;21:451–460. - PubMed

Publication types

LinkOut - more resources