. 2009 Jan;27(1):84-90.
doi: 10.1038/nbt.1517. Epub 2008 Dec 5.

Analysis of histone 2B-GFP retention reveals slowly cycling hematopoietic stem cells

Affiliations

Analysis of histone 2B-GFP retention reveals slowly cycling hematopoietic stem cells

Adlen Foudi et al. Nat Biotechnol. 2009 Jan.

Abstract

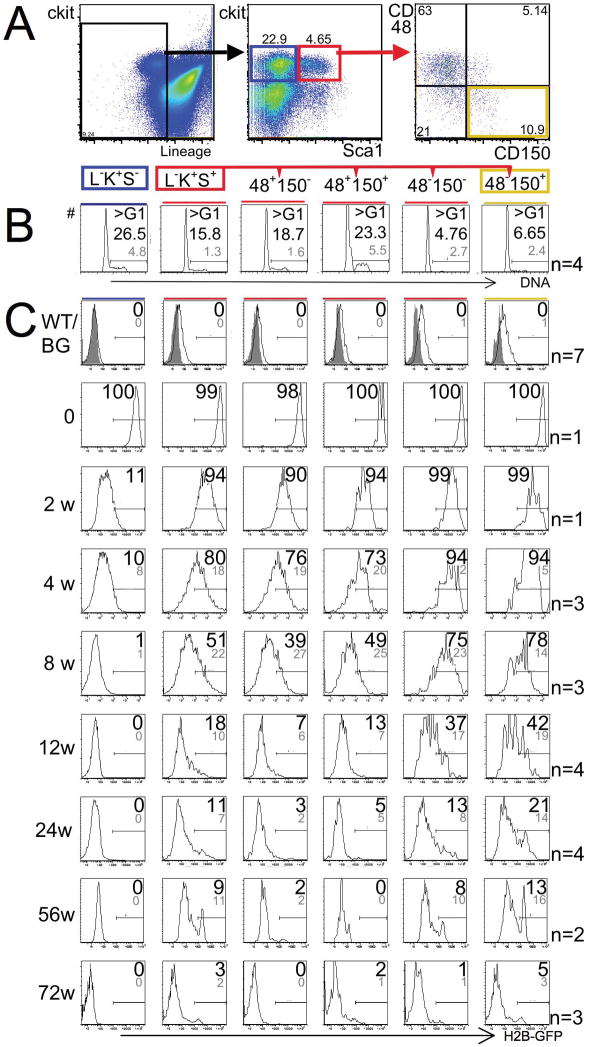
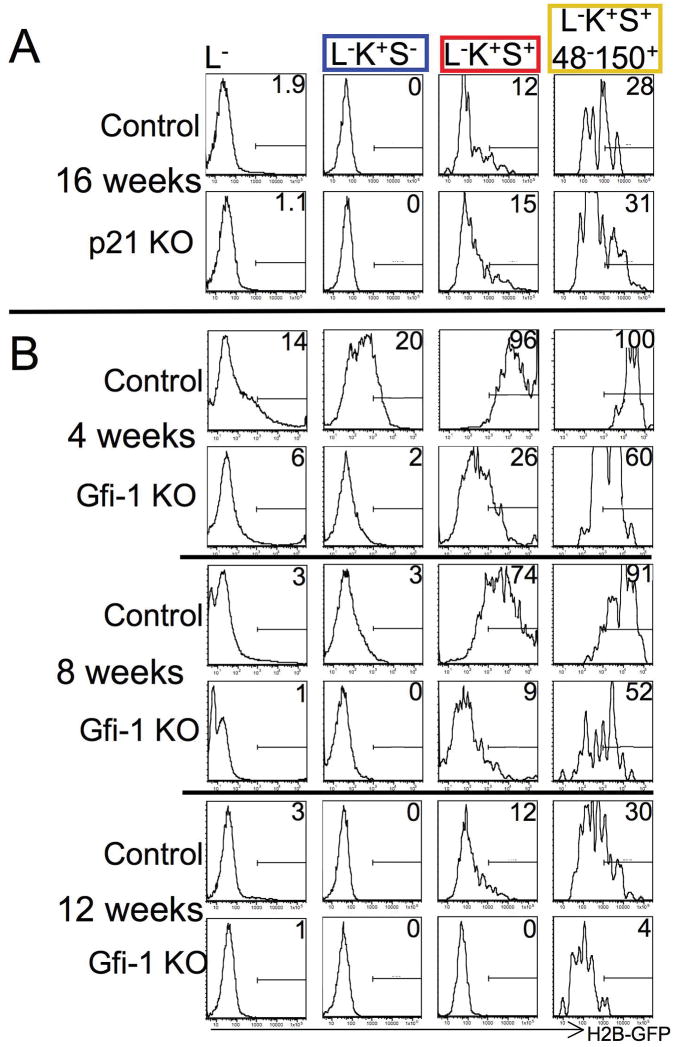
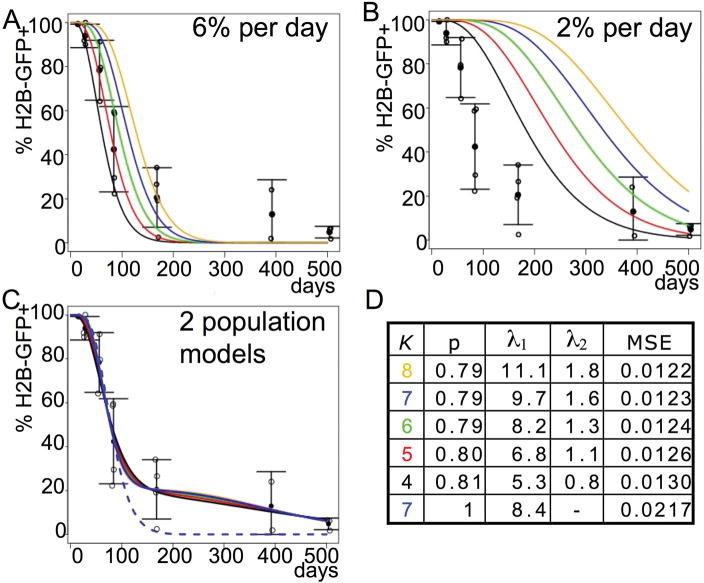
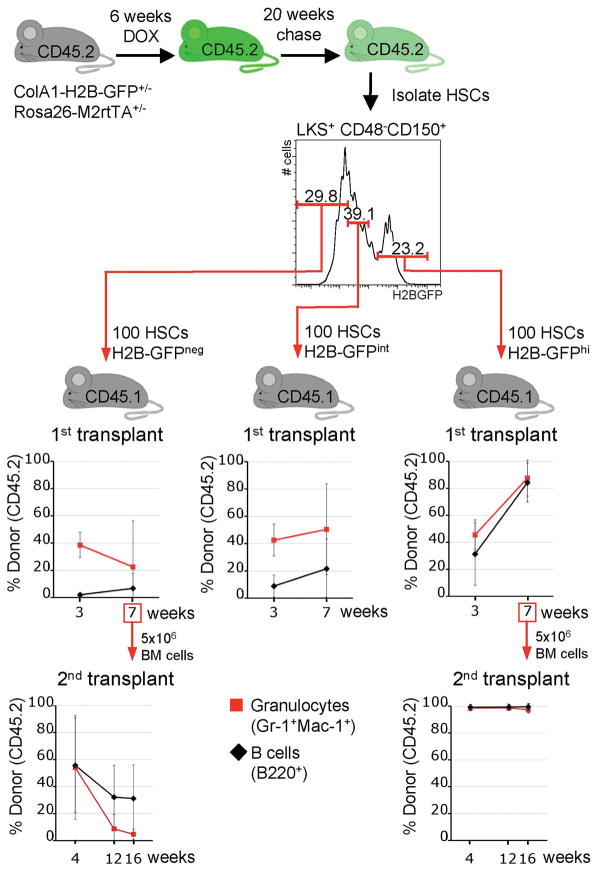
Hematopoietic stem cells (HSCs) are thought to divide infrequently based on their resistance to cytotoxic injury targeted at rapidly cycling cells and have been presumed to retain labels such as the thymidine analog 5-bromodeoxyuridine (BrdU). However, BrdU retention is neither a sensitive nor specific marker for HSCs. Here we show that transient, transgenic expression of a histone 2B (H2B)-green fluorescent protein (GFP) fusion protein in mice has several advantages for label-retention studies over BrdU, including rapid induction of H2B-GFP in virtually all HSCs, higher labeling intensity and the ability to prospectively study label-retaining cells, which together permit a more precise analysis of division history. Mathematical modeling of H2B-GFP dilution in HSCs, identified with a stringent marker combination (L(-)K(+)S(+)CD48(-)CD150(+)), revealed unexpected heterogeneity in their proliferation rates and showed that approximately 20% of HSCs divide at an extremely low rate (< or =0.8-1.8% per day).


Figures

Figure 1
Figure 1. Immuno-phenotype predicts cell cycle-stage distribution and retention of H2B-GFP in early hematopoietic cells
(A) Gating strategy for the analysis of progenitors and HSCs in the bone marrow. Left panel shows exclusion of dead (PI+) and lineage marker-expressing cells; previous forward and side scatter gates for exclusion of debris and enucleated red cells are not shown. Middle panel shows gates for committed myeloid progenitors (left, blue frame, Lineage (L) , c-Kit (K)+, Sca1 (S) ) and enriched, but impure, HSCs (right, red frame, LK+S+). Right panel shows further resolution of enriched HSC population with SLAM markers CD48 and CD150; highly purified HSCs are found in the right lower quadrant (yellow frame). (B) Cell-cycle stage distribution of early hematopoietic populations (as shown in A) assessed by visualizing DNA content with Hoechst 33342 dye. Shown are representative histograms; gates distinguish cells in G0/G1 from cells in S/G2/M phases of the cell cycle. Numbers show percentage of cells in S/G2/M (means: large black number; standard deviation: small grey number); difference between LK+S-cells (blue box) and LK+S+-cells (red box) is significant (p=0.005); difference between CD150+CD48LK+S+- cells (yellow box) and CD150CD48LK+S+- cells (second from right) is not significant (p=0.15); difference between CD150+CD48LK+S+- cells (yellow box) and either of the CD48+ populations (two middle panels) is significant p<0.001. (C) Expression of H2B-GFP in immuno-phenotypically defined early hematopoietic populations over time. In each column, analyses of a defined population (order as in B) are shown without pulse (first row), immediately after the pulse (second row), or at defined time points after the pulse (designated on the left in weeks (w), rows 3 – 9). Individual plots are representative histograms of H2B-GFP intensity on a logarithmic scale (x-axis covers 5 orders of magnitude). Large black numbers on individual plots show proportions (%) of H2B-GFP-positive cells above the arbitrary threshold. When multiple mice were analyzed, means are given and standard deviations are shown in smaller grey numbers (number of mice (n) per time point are shown on the right of the figure). Plots in first row show that H2B-GFP background (BG) is elevated in un-induced transgenic mice (black line, n=7, aged 2 to 15 months) as compared with wildtype (WT) mice (grey shaded area); arbitrary threshold was set above background as shown. Note: H2B-GFP is lost within 8 –12 weeks in progenitors (LK+S; first column from left, blue box) and is retained the most in highly purified hematopoietic stem cells (CD150+CD48LS+K+; first column from right, yellow box).
Figure 2
Figure 2. Accelerated H2B-GFP loss in Gfi-1−/− but not p21Cip1/Waf1−/− HSCs
(A) No increased turnover of p21CIP1/WAF1−/− HSCs. Mice lacking p21CIP1/WAF1 and control mice were pulsed with doxycycline for 6 weeks. After 16 weeks of chase, H2B-GFP retention was analyzed in the entire lineage-marker-negative population (first column), committed myeloid progenitors (second column, blue frame), enriched but impure HSCs (third column, red frame), and highly purified HSCs (fourth column, yellow frame). (B) Increased turnover of Gfi-1−/− HSCs. Analysis after 4, 8, and 12 weeks of chase. Note loss of H2B-GFP in all early bone marrow populations, including HSCs, in Gfi-1−/− mice by 12 weeks. Letter/number-code for cell markers on top as in Fig. 1A. Representative data are shown. For each genotype, at least 4 mice were analyzed after 3 – 4 months of chase.
Figure 3
Figure 3. Mathematical modeling of H2B-GFP retention in HSCs
(LS+K+CD48CD150+). (A, B) Models for H2B-GFP loss over time based on homogeneous HSC division rates of 6% per day (A) and 2% per day (B). Colored lines show models based on 4 (black), 5 (red), 6 (green), 7 (blue), or 8 (yellow) divisions for H2B-GFP to fall below the arbitrary detection threshold. Open circles represent the observed proportions of cells positive for H2B-GFP over time (derived from experiments shown in Fig. 1, LS+K+CD48CD150+, first column from right). Closed circles show averages, error bars show standard deviations. Note: neither a high (6%/day) nor a low (2%/day) rate fits the data at both early and late time points. (C) Models based on mixture of two populations dividing at different rates. Color codes are as indicated above. Parameters for the models are shown in the adjacent table D. (D) K indicates the number of divisions until H2B-GFP falls below threshold (models for different K’s correspond to colored curves in C); P denotes the proportion of the larger population (rounded); λ1 denotes the proportion of cells cycling per day in the larger population (%), λ2 denotes the proportion of cells cycling in the smaller population. Shown are values of K and associated optimal estimates for P, λ1, λ2, and the mean squared error (MSE) for each model. Note: Curves for different Ks appear superimposed because P, λ1, and λ2 were varied to fit the data optimally for each K. The bottom row (dashed blue curve in C) is the optimal homogeneous model for K=7 exhibiting a substantial degradation of fit (higher MSE).
Figure 4
Figure 4. H2B-GFP retention of LK+S+CD48CD150+-HSCs predicts function
100 LK+S+CD48CD150+-defined HSCs from H2B-GFP transgenic mice (CD45.2) were transplanted into irradiated recipients (CD45.1) together with a small number of support bone marrow cells (CD45.1) to ensure survival. Three upper plots show the proportions of donor-derived B-cells and granulocytes in groups of recipient mice (primary recipients; H2B-GFPneg, left, n=4; H2B-GFPint, middle, n=3; H2B-GFPhi, right, n=2). Note that cells with the same immuno-phenotype, but distinct H2B-GFP content, harbor strikingly different repopulation potential. Bottom panels show donor-derived hematopoiesis in recipients of secondary transplants (performed 7 weeks after the primary transplant) from either the H2B-GFPneg group (left, n=5, donor was the most highly reconstituted primary transplant recipient) or the H2B-GFPhi group (right, n=5). Means and standard deviations (error bars) are shown.

References

    1. Lerner C, Harrison DE. 5-Fluorouracil spares hemopoietic stem cells responsible for long-term repopulation. Exp Hematol. 1990;18:114–8. - PubMed
    1. Van Zant G. Studies of hematopoietic stem cells spared by 5-fluorouracil. J Exp Med. 1984;159:679–90. - PMC - PubMed
    1. Kiel MJ, et al. Haematopoietic stem cells do not asymmetrically segregate chromosomes or retain BrdU. Nature. 2007;449:238–42. - PMC - PubMed
    1. Kiel MJ, et al. SLAM family receptors distinguish hematopoietic stem and progenitor cells and reveal endothelial niches for stem cells. Cell. 2005;121:1109–21. - PubMed
    1. Arai F, et al. Tie2/angiopoietin-1 signaling regulates hematopoietic stem cell quiescence in the bone marrow niche. Cell. 2004;118:149–61. - PubMed

Publication types