. 2009 Jan;10(1):109-15.
doi: 10.1038/ni.1680. Epub 2008 Dec 7.

ADAR1 is essential for the maintenance of hematopoiesis and suppression of interferon signaling

Affiliations

ADAR1 is essential for the maintenance of hematopoiesis and suppression of interferon signaling

Jochen C Hartner et al. Nat Immunol. 2009 Jan.

Erratum in

  • Nat Immunol. 2009 May;10(5):551

Abstract

The deaminase ADAR1 edits adenosines in nuclear transcripts of nervous tissue and is required in the fetal liver of the developing mouse embryo. Here we show by inducible gene disruption in mice that ADAR1 is essential for maintenance of both fetal and adult hematopoietic stem cells. Loss of ADAR1 in hematopoietic stem cells led to global upregulation of type I and II interferon-inducible transcripts and rapid apoptosis. Our findings identify ADAR1 as an essential regulator of hematopoietic stem cell maintenance and suppressor of interferon signaling that may protect organisms from the deleterious effects of interferon activation associated with many pathological processes, including chronic inflammation, autoimmune disorders and cancer.


Figures
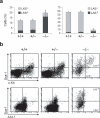
Fig. 1
Fig. 1. ADAR1 is dispensable for the emergence of phenotypic HSCs and MPPs in the fetal liver
(a) Graphs represent the frequencies of live, lineage depleted (Lin) cells from E11.25 FL analyzed for c-Kit and Sca-1 (LKS) or AA4.1 and Sca-1 (LAS) expression LKS+ and LAS+ HSCs (dark grey bars), and LKS and LAS progenitors (light grey bars). Data are expressed as mean ± s.d. (3−5 tissues for each genotype). Statistical significance was determined by unpaired t test with p-values ranging from <0.0001 to 0.0328 (p<0.05 is considered statistically significant by this test). (b) Representative flow cytometry profiles of live Lin c-Kit+ Sca-1+ (LKS+), Lin c-Kit+ Sca-1 (LKS), Lin AA4.1+ Sca-1+ (LAS+), and Lin AA4.1+ Sca-1 (LAS).
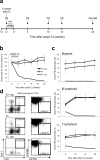
Fig. 2
Fig. 2. Near-complete loss of fetal liver contribution to adult bone marrow hematopoiesis after induced ADAR1 deficiency
(a) Schematic diagram of experimental design. Peripheral blood (PB) and bone marrow (BM) were analyzed at indicated time points. PolyI-polyC (poly(I:C)) was administered in seven doses (small vertical arrows) over a two-week period beginning five weeks after transplantation (Tx) (time point −2 weeks). The day of the last poly(I:C) dose is designated 0 weeks after poly(I:C). (b) Contribution of FL derived, CD45.2 expressing (donor) cells to PB leukocytes at indicated time points. (c) Donor contribution to peripheral myeloid (Mac-1+/Gr-1+), B-lymphoid (B220+), and T-lymphoid (CD4+/CD8+) lineages. (d) Representative flow cytometry profiles and absolute numbers per femur of donor derived LKS+ cells (left panel, black frames) and Lineage-negative CD150+CD48 (L150+) cells (right panel, black frames) in recipient bone marrow at 23 weeks after poly(I:C) treatment. Absolute HSC numbers per femur: 4,260 ± 114 LKS+ and 2,860 ± 370 L150+ cells (f/+.mx); 7,220 ± 910 LKS+ and 3,550 ± 760 L150+ cells (f/−); 130 ± 50 LKS+ and 880 ± 130 L150+ cells (f/−.mx). All data presented in (b-d) are expressed as mean ± s.e.m. (4−5 animals in each group).
Fig. 3
Fig. 3. Induced deletion of ADAR1 in HSCs of adult mice leads to hyperproliferation and apoptosis
(a) Absolute numbers of total bone marrow cells (grey bars), and frequencies of HSCs (LKS+) and progenitors (LKS) in induced (Tam) and uninduced (No tam) adult mice. (b) Numbers of methylcellulose colonies grown from 12,500 bone-marrow cells of induced (Tam) and uninduced (No tam) Adar.sc mice, and representative Adar allele and scl-Cre transgene specific genomic PCR analysis of individual colonies from Adarf/+.sc (upper panel) and Adarf/−.sc (lower panel) bone marrow. DNA size markers (M) and no-template controls (N) are indicated. (c) Representative flow cytometry profiles of bone-marrow LKS+ HSCs (red ellipse) analyzed for apoptotic and necrotic cell death by Annexin V / 7-amino-actinomycin D (7-AAD) staining. Frequencies of apoptotic LKS+ HSCs (red frame): 3.2 ± 3.6 % (f/−, no tam); 13.3 ± 5.1 % (f/+, tam); 6.1 ± 0.8 % (f/+.sc, tam); 68.0 ± 26.2 % (f/− .sc, tam). (d) Representative cell cycle analysis of LKS+CD34lo long-term (LT-) HSCs, LKS+CD34hi short-term (ST-) HSCs, and LKS multipotent progenitors (MPP). Numbers represent the frequency of cells in S-phase. All data presented in (a-d) are expressed as mean ± s.d. (3 mice per experimental group and 2 mice in each control group).
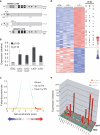
Fig. 4
Fig. 4. ADAR1 deficiency in HSCs leads to a global upregulation of interferon-inducible transcripts
(a) Schematic drawing of two murine ADAR1 mRNA and protein species. ADAR1 p150 protein is encoded by an mRNA transcribed from an interferon-inducible promoter (Pi), and ADAR1 p110 protein is encoded by an mRNA transcribed from a constitutively active promoter (PC). Translation start sites (AUG) within transcripts are indicated. White boxes, 5’-untranslated region (UTR); thick black horizontal lines, regions amplified by real-time PCR, broken horizontal lines, 3’-UTR; dark-grey boxes, putative Z-DNA binding domains (α and β); black boxes, RNA binding domains (I-III); closed circles, conserved residues within deaminase domain. (b) Real-time PCR analysis of ADAR1 mRNA expression in ES cells (ESC), long-term (LKS+CD34lo) and short-term (LKS+CD34hi) HSCs, total HSCs (LKS+), and multipotent progenitors (LKS) using oligonucleotides specific for the IFN-inducible ADAR1 p150 (dark grey bars) and the constitutive ADAR1 p110 (light grey bars) transcripts. ADAR1 mRNA expression was normalized to YWHAZ (GenBank™/EBI accession number 22631) mRNA expression using the ΔΔCt method. Data are expressed as mean ± s.d. (c) Gene set enrichment analysis of genome-wide transcriptome expression data from ADAR1−/− (KO) relative to control HSCs. Among 1247 curated gene sets (represented by green dots), those that were annotated as upregulated by interferon signaling are colored in red, whereas those downregulated by interferon signaling are represented by blue dots. Positive net enrichment scores denote gene sets that were upregulated in KO cells. Negative scores reflect downregulated gene sets. The yellow area contains significantly altered gene sets with a false-discovery rate (FDR) of <0.05. (d) Heat map of the most significantly deregulated genes (FDR<0.1), ranked by t test score. Red color reflects high expression, and blue color indicates low expression. Black dots label genes known to be inducible by interferons (IFN) α, β, or γ. (e) Validation of gene array data by quantitative PCR. The graph shows mRNA expression of representative genes normalized to YWHAZ mRNA expression in lineage-depleted CD150+CD48CD244 (HSC) and CD150CD48+ (MPP) cells from early-E11 wild-type (+/+), Adar+/− (+/−), and ADAR1-deficient (−/−) FL. Data are expressed as mean ± s.e.m. (2−6 samples per group). White column tops indicate statistically significant differences (p value < 0.03) between Adar−/− and control cells, as determined by unpaired t test. Names of known interferon-inducible genes are in red color.
Fig. 5
Fig. 5. Suggested model for the role of ADAR1 in HSCs
Vertical arrows mark the transition from long-term (LT-) HSC via short-term (ST-) HSC to multipotent progenitor (MPP) as defined by lineage marker (Lin), cKit (K), Sca-1 (S), and CD34 surface expression. Semi-circled arrows indicate self-renewal. Both ADAR1-deficient (Adar−/−) HSCs and MPPs exhibit a global upregulation of transcripts encoding interferon-stimulated genes (ISGs), including Sca-1, as compared with wild-type and Adar+/− (Adar+/±)cells. Differentiation of lineage-negative, cKit-positive, Sca-1-positive, CD34-negative/low (LKS+ CD34lo) LT-HSCs via ST-HSCs (LKS+ CD34hi) and MPPs (LKS CD34hi) is accompanied by an increase in CD34 and a decrease in Sca-1 surface expression. Perhaps as a consequence of the interferon pathway activation in absence of ADAR1, LKS+ HSCs fail to downregulate Sca-1 and undergo rapid apoptosis as they progress to the LKSprogenitor stage of hematopoiesis.

Comment in

Similar articles

Cited by

References

    1. Bass BL. RNA editing by adenosine deaminases that act on RNA. Annual review of biochemistry. 2002;71:817–846. - PMC - PubMed
    1. Athanasiadis A, Rich A, Maas S. Widespread A-to-I RNA editing of Alu-containing mRNAs in the human transcriptome. PLoS biology. 2004;2:e391. - PMC - PubMed
    1. Kim DD, et al. Widespread RNA editing of embedded alu elements in the human transcriptome. Genome research. 2004;14:1719–1725. - PMC - PubMed
    1. Levanon EY, et al. Systematic identification of abundant A-to-I editing sites in the human transcriptome. Nature biotechnology. 2004;22:1001–1005. - PubMed
    1. Kawahara Y, et al. Science. Vol. 315. New York, N.Y: 2007. Redirection of silencing targets by adenosine-to-inosine editing of miRNAs. pp. 1137–1140. - PMC - PubMed

Publication types

Associated data