. 2009 Jan;41(1):35-46.
doi: 10.1038/ng.271. Epub 2008 Dec 7.

Genome-wide association analysis of metabolic traits in a birth cohort from a founder population

Affiliations

Genome-wide association analysis of metabolic traits in a birth cohort from a founder population

Chiara Sabatti et al. Nat Genet. 2009 Jan.

Abstract

Genome-wide association studies (GWAS) of longitudinal birth cohorts enable joint investigation of environmental and genetic influences on complex traits. We report GWAS results for nine quantitative metabolic traits (triglycerides, high-density lipoprotein, low-density lipoprotein, glucose, insulin, C-reactive protein, body mass index, and systolic and diastolic blood pressure) in the Northern Finland Birth Cohort 1966 (NFBC1966), drawn from the most genetically isolated Finnish regions. We replicate most previously reported associations for these traits and identify nine new associations, several of which highlight genes with metabolic functions: high-density lipoprotein with NR1H3 (LXRA), low-density lipoprotein with AR and FADS1-FADS2, glucose with MTNR1B, and insulin with PANK1. Two of these new associations emerged after adjustment of results for body mass index. Gene-environment interaction analyses suggested additional associations, which will require validation in larger samples. The currently identified loci, together with quantified environmental exposures, explain little of the trait variation in NFBC1966. The association observed between low-density lipoprotein and an infrequent variant in AR suggests the potential of such a cohort for identifying associations with both common, low-impact and rarer, high-impact quantitative trait loci.
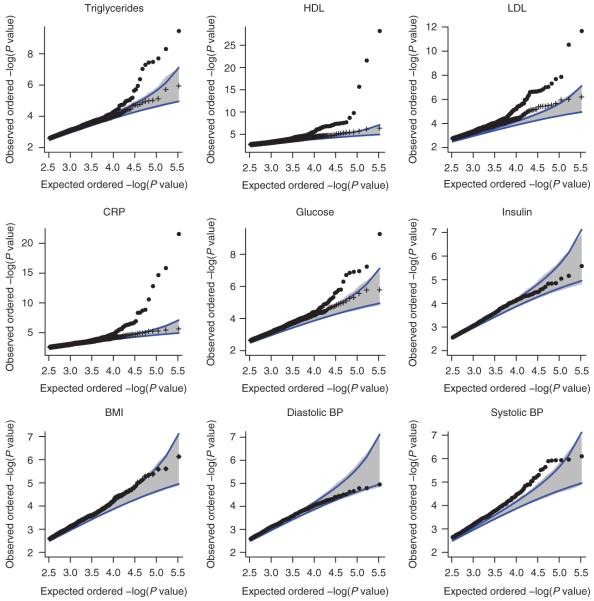

Figures

Figure 1
Figure 1
Linguistic/geographic groups of Northern Finland and their genetic signature. (a) Map of Finland with county boundaries. The subjects in NFBC1966 were all born in the two northern provinces. Counties in Northern Finland are color coded to correspond to the six linguistic/geographical groups that can be identified. (b) Scatterplot of the two first components identified by MDS on the matrix of genetic similarity between individuals. Only subjects with both parents born in the same population group are plotted, and they are color coded according to the group of origin.
Figure 2
Figure 2
Quantile-quantile plots of the tails of the P-value distribution for the nine traits. Scatter plot of the observed ordered −log10 P values versus the −log10 expected ordered P values under the complete null for N = 329,091 tests (solid circles). Only the 1,000 lowest P values are considered. Blue lines and gray shaded areas indicate the 0.025 and 0.975 point-wise quantiles of the ordered P value under the complete null distribution. The percentiles depicted with blue lines were calculated using a beta approximation for the distribution of ordered statistics of uniform variates and assuming independence across tests. The gray shaded areas were obtained with 1,000 permutations. Crosses indicate the observed ordered −log10 P values excluding tests that correspond to a known region or to a newly identified hit. These are also plotted against the −log10 expected ordered P values for the same number of tests under the complete null distribution.
Figure 3
Figure 3
Association P values for genotyped SNPs for the nine traits. Genomic position is on the x axis (chromosome number is indicated at the bottom of the plot). The −log10 of the association P value is on the y axis. Only P values <10−2 are displayed. To increase readability, the −log10(P values) are truncated at 12. The horizontal red line corresponds to a P value of 5 × 10⁻⁷. Blue vertical lines indicate position of loci recently identified in GWAS (Table 3).
Figure 4
Figure 4
Association signal in the nine newly identified loci. Association results are shown in relation to RefSeq genes and LD and genetic maps in the region of our findings. For each region the top panel depicts the 2-Mb region around each of our findings. The horizontal line corresponds to P < 5 × 10⁻⁷. The vertical lines demarcate the 2 LD unit area around each new finding. Open symbols represent association results from our genotyped SNPs; smaller closed symbols represent association results of nongenotyped, imputed HapMap SNPs using WHAP. The middle panel depicts the location of known RefSeq genes. Genes that overlap are presented on two lines. The bottom panel displays the LD (solid line) and genetic (dashed line) maps. The midpoint of our evidence was set to be zero on both maps. The horizontal line is at 2 LD units. Note that for the HDL locus on chromosome 11 and for the LDL locus on chromosome X LD was so extensive that the 2 LD unit boundaries exceeded a 2-Mb region; therefore, the physical extent of the area plotted for these two regions was increased in order for the 2 LD unit boundaries to be shown.
Figure 5
Figure 5
Graphical representation of the proportion of explained variance for each of the five traits for which genetic loci have been identified. The total explained variance with a model that includes all the genetic loci (either described in Table 2 or 3) and the variables listed in Supplementary Table 3 is indicated in gray; the proportion of variance explained by the genetic loci is indicated in red.

Comment in

Similar articles

Cited by

References

    1. Rantakallio P. Groups at risk in low birth weight infants and perinatal mortality. Acta Paediatr. Scand. Suppl. 1969;193:43. - PubMed
    1. Jarvelin MR, et al. Early life factors and blood pressure at age 31 years in the 1966 northern Finland birth cohort. Hypertension. 2004;44:838–846. - PubMed
    1. Varilo T, Peltonen L. Isolates and their potential use in complex gene mapping efforts. Curr. Opin. Genet. Dev. 2004;14:316–323. - PubMed
    1. Service S, et al. Magnitude and distribution of linkage disequilibrium in population isolates and implications for genome-wide association studies. Nat. Genet. 2006;38:556–560. - PubMed
    1. Manolio TA, Bailey-Wilson JE, Collins FS. Genes, environment and the value of prospective cohort studies. Nat. Rev. Genet. 2006;7:812–820. - PubMed

Publication types

MeSH terms