. 2008 Nov;59(4):475-494.
doi: 10.1016/j.jml.2007.11.006.

Statistical and computational models of the visual world paradigm: Growth curves and individual differences

Affiliations

Statistical and computational models of the visual world paradigm: Growth curves and individual differences

Daniel Mirman et al. J Mem Lang. 2008 Nov.

Abstract

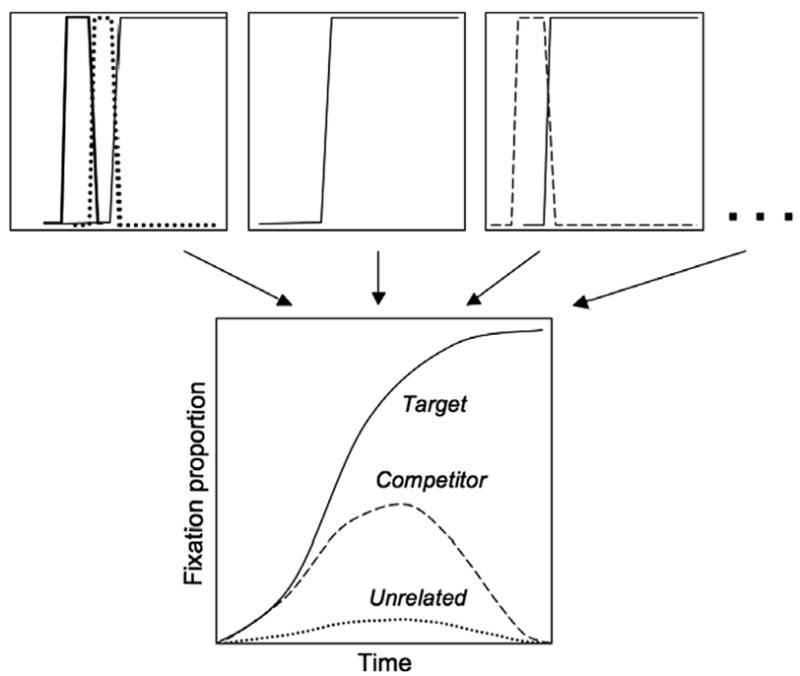
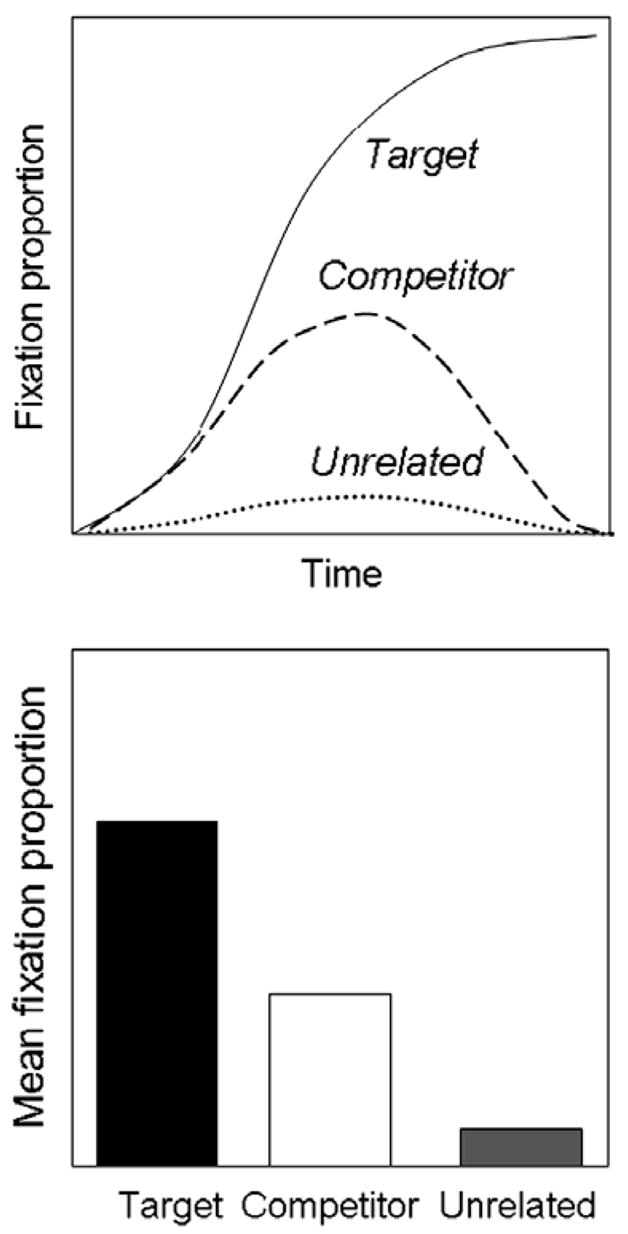
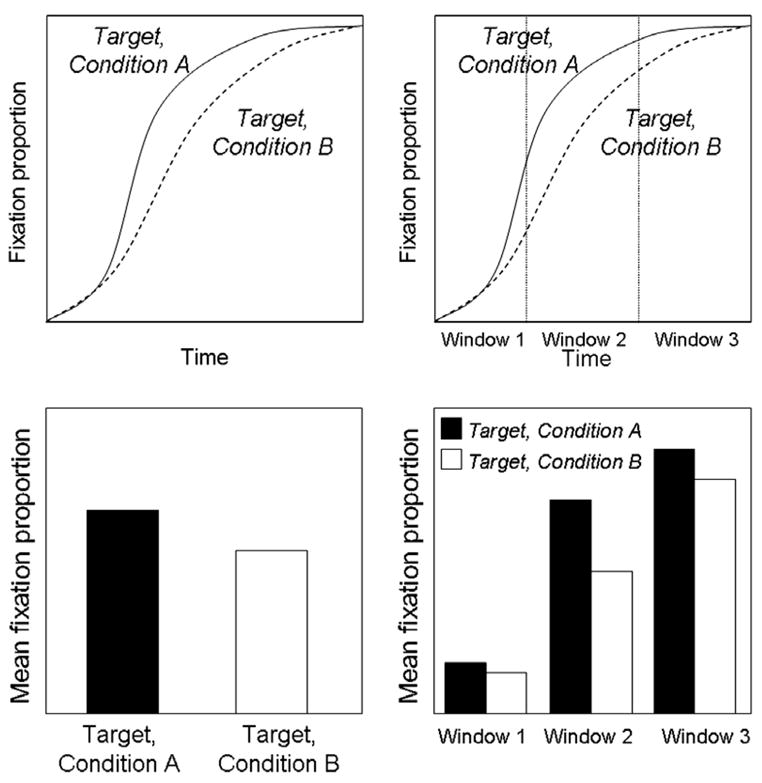
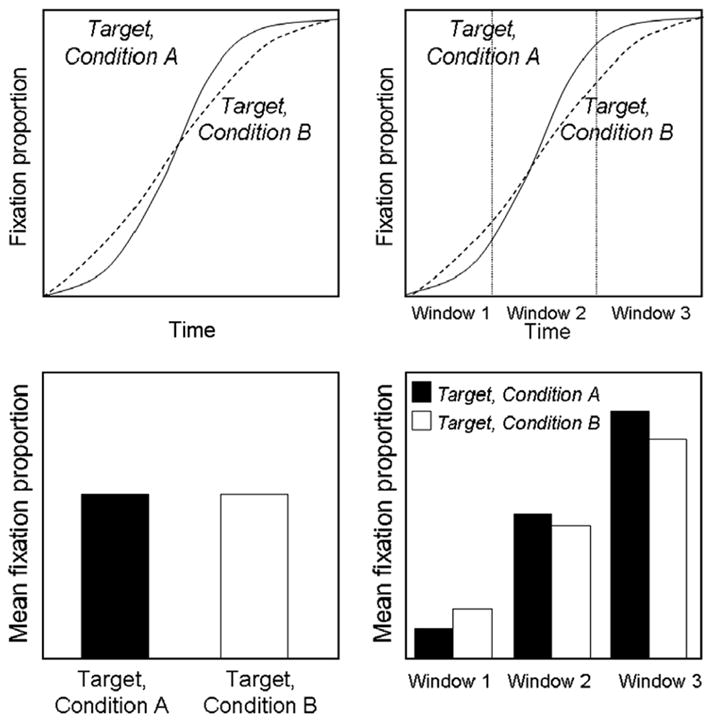
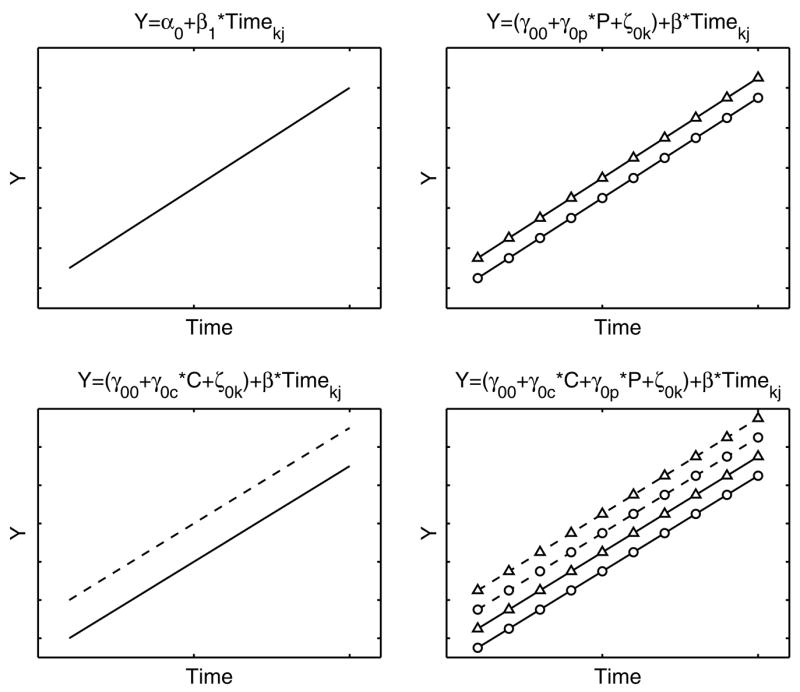
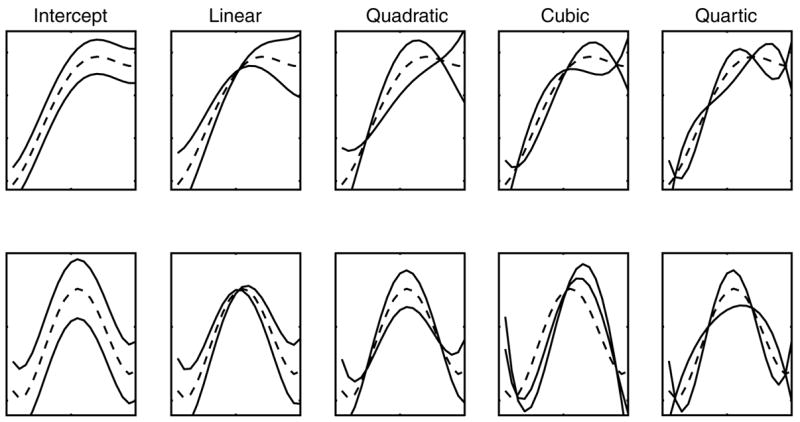
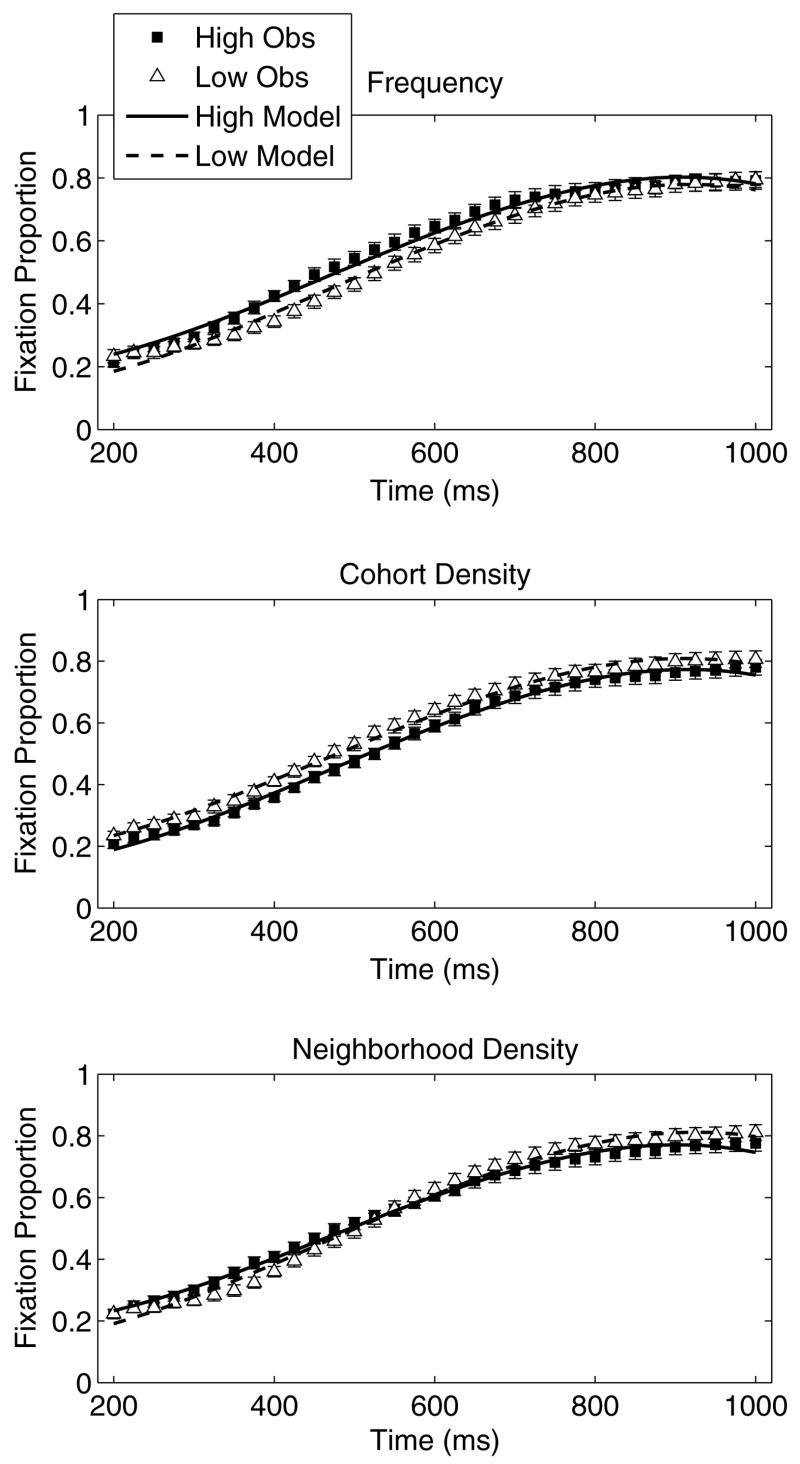
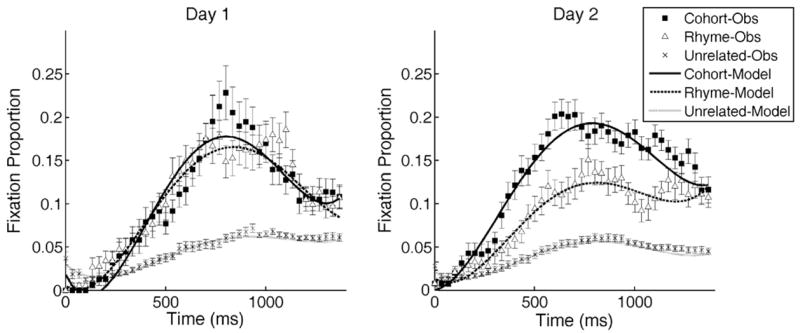
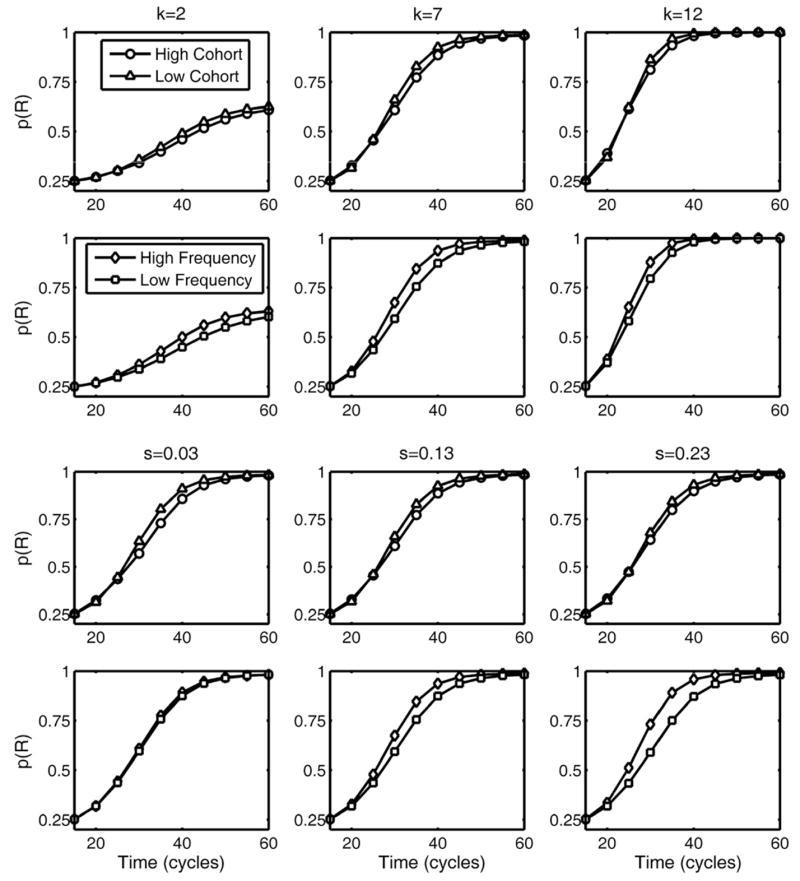
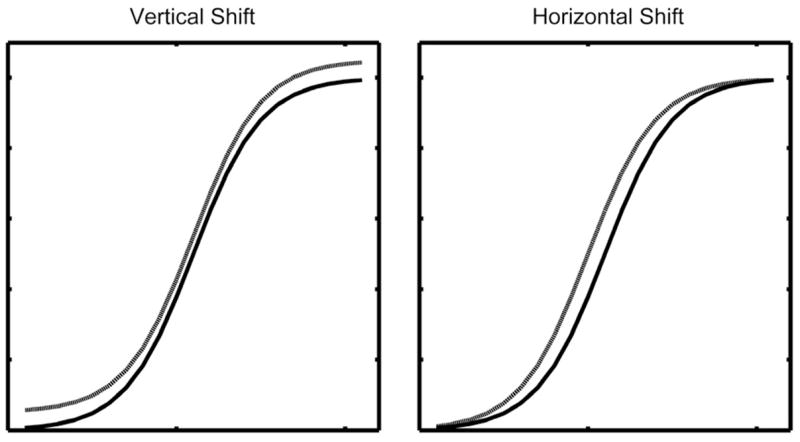
Time course estimates from eye tracking during spoken language processing (the "visual world paradigm", or VWP) have enabled progress on debates regarding fine-grained details of activation and competition over time. There are, however, three gaps in current analyses of VWP data: consideration of time in a statistically rigorous manner, quantification of individual differences, and distinguishing linguistic effects from non-linguistic effects. To address these gaps, we have developed an approach combining statistical and computational modeling. The statistical approach (growth curve analysis, a technique explicitly designed to assess change over time at group and individual levels) provides a rigorous means of analyzing time course data. We introduce the method and its application to VWP data. We also demonstrate the potential for assessing whether differences in group or individual data are best explained by linguistic processing or decisional aspects of VWP tasks through comparison of growth curve analyses and computational modeling, and discuss the potential benefits for studying typical and atypical language processing.


Figures

Fig. 1
Fig. 1
Schematic of typical eye movement averaging for the visual world paradigm. For individual trials (top), a participant can only fixate one object at a time, giving a time series of 0.0 and 1.0 proportions for each possible fixation target. Trials are averaged (typically across items and participants) to yield continuous time-course estimates of, e.g., lexical activation and competition.
Fig. 2
Fig. 2
Schematic of “area” analyses. Proportions over time for a target, competitor, and unrelated item (top) are converted to single numbers—average fixation proportion over the entire time window (or some smaller window).
Fig. 3
Fig. 3
Area analyses comparing target proportions in different conditions with a single time window (left) and three successive time windows (right). A common approach is to define a series of time windows (often many more than three) and to include “window” in a repeated measures ANOVA (violating independence assumptions, since successive windows are strongly related).
Fig. 4
Fig. 4
An example of a case where multiple windows are required to capture change over time; in this case, target proportion interacts with time. Two or more windows are required to capture this interaction, but window selection is problematic (see text).
Fig. 5
Fig. 5
Schematic of multilevel linear model approach. The top left panel shows the level-1 model. The top right panel adds a level-2 model that includes an effect of participant P, triangles and circles correspond to two different participants. The bottom left panel adds a level-2 model that includes an effect of condition C, solid and dashed lines correspond to two different conditions. The bottom right panel combines these level-2 models so that both condition and participant effects are represented.]
Fig. 6
Fig. 6
Effects of manipulating individual model parameters on the shape of VWP fixation proportion curves. The top row shows schematic target fixation curves (roughly monotonic rising indicating increasing activation), the bottom row shows schematic competitor fixation curves (rise and fall trajectory indicating transient activation). Each panel shows three levels for a single parameter, the middle value is shown as a dashed line for ease of interpretation.
Fig. 7
Fig. 7
Observed data (symbols) and model fits (lines) for frequency (top panel), cohort density (middle panel), and neighborhood density (bottom panel) effects. Reprinted with permission from Magnuson et al. (2007).
Fig. 8
Fig. 8
Observed (symbols) data for cohort competitors (squares), rhyme competitors (triangles) and unrelated distractors (x’s) and model fits (lines). Error bars indicate ±1SE. On day 1, there is equivalent cohort and rhyme competition (higher fixation proportion for competitors than unrelated items); on day 2 the time course of cohort and rhyme competition is significantly different (see text for details).
Fig. 9
Fig. 9
TRACE “individual difference” plots of cohort (first and third row) and frequency (second and fourth row) effects under manipulation of k (top two rows) and s (bottom two rows). Manipulation of k primarily affects curve shape and cohort and frequency effects tend to increase together. Manipulation of s has small impact on curve shape and opposite effects on frequency and cohort effects.
Fig. 10
Fig. 10
Schematic demonstration of data from two conditions that differ by a constant advantage (vertical shift, left panel) or by time course of activation (horizontal shift, right panel).

References

    1. Allopenna PD, Magnuson JS, Tanenhaus MK. Tracking the time course of spoken word recognition using eye movements: Evidence for continuous mapping models. Journal of Memory and Language. 1998;38:419–439.
    1. Altmann GTM, Kamide Y. Incremental interpretation at verbs: Restricting the domain of subsequent reference. Cognition. 1999;73:247. - PubMed
    1. Chambers CG, Tanenhaus MK, Magnuson JS. Actions and affordances in syntactic ambiguity resolution. Journal of Experimental Psychology: Learning, Memory, and Cognition. 2004;30:687–696. - PubMed
    1. Cooper RM. The control of eye fixation by the meaning of spoken language: A new methodology for the real-time investigation of speech perception, memory, and language processing. Cognitive Psychology. 1974;6:84–107.
    1. Dahan D, Magnuson JS, Tanenhaus MK. Time course of frequency effects in spoken-word recognition: Evidence from eye movements. Cognitive Psychology. 2001a;42:317–367. - PubMed

LinkOut - more resources