. 2008 Dec 30;47(52):13754-63.
doi: 10.1021/bi801666c.

Interactions of human O(6)-alkylguanine-DNA alkyltransferase (AGT) with short double-stranded DNAs

Affiliations

Interactions of human O(6)-alkylguanine-DNA alkyltransferase (AGT) with short double-stranded DNAs

Manana Melikishvili et al. Biochemistry. .

Abstract

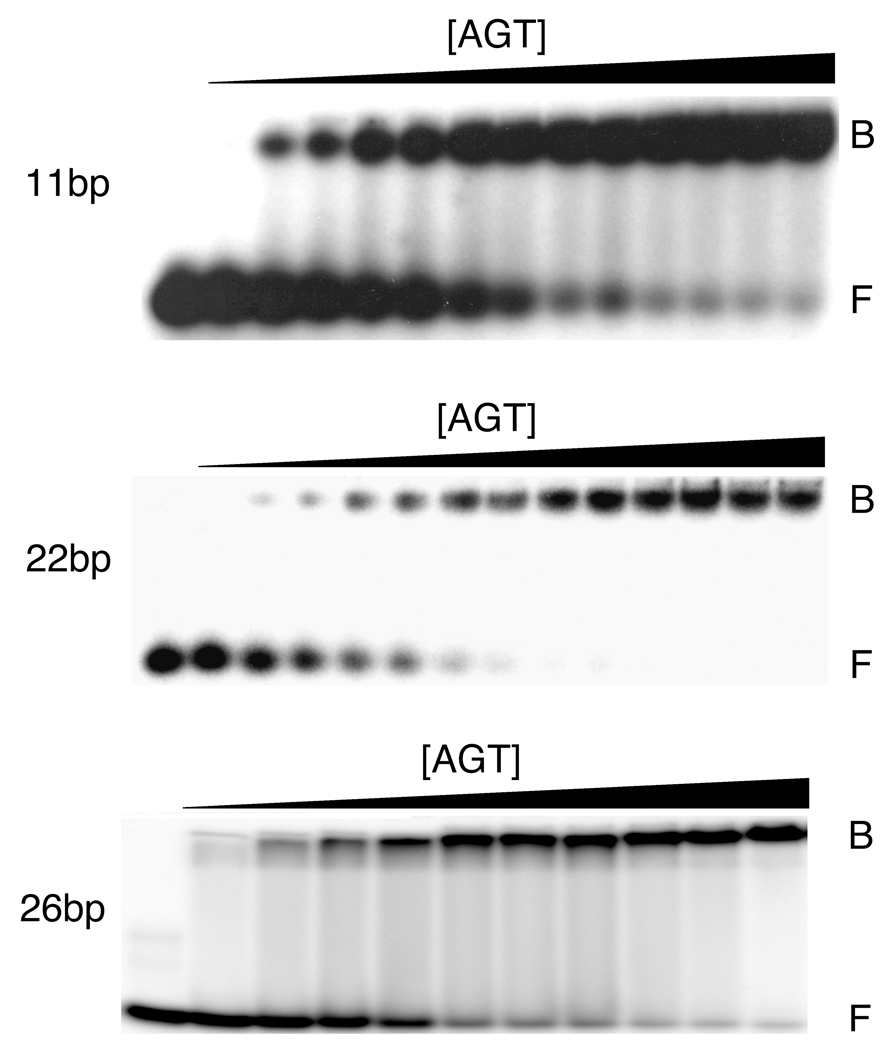
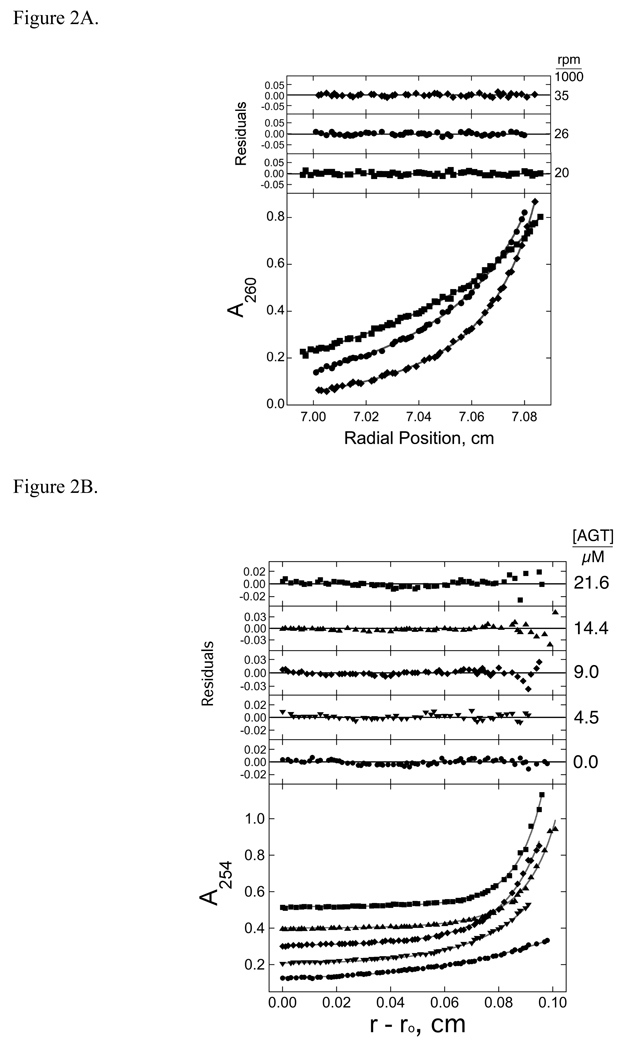
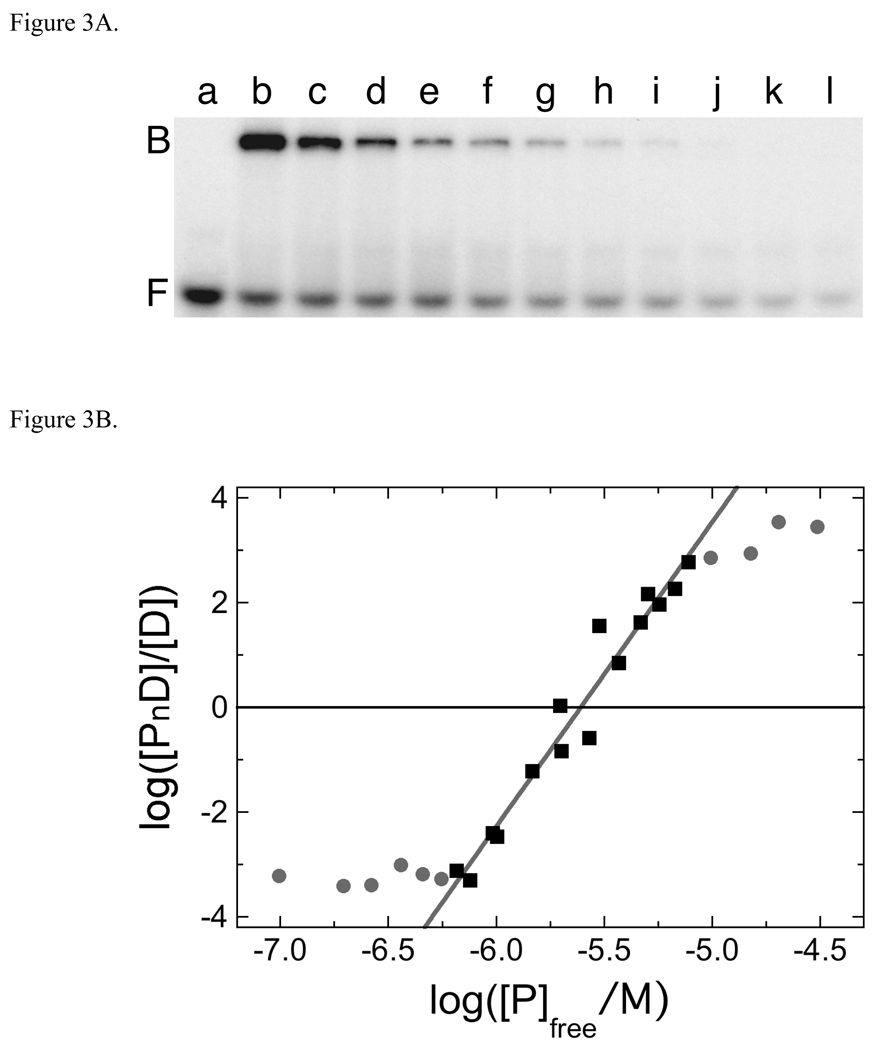
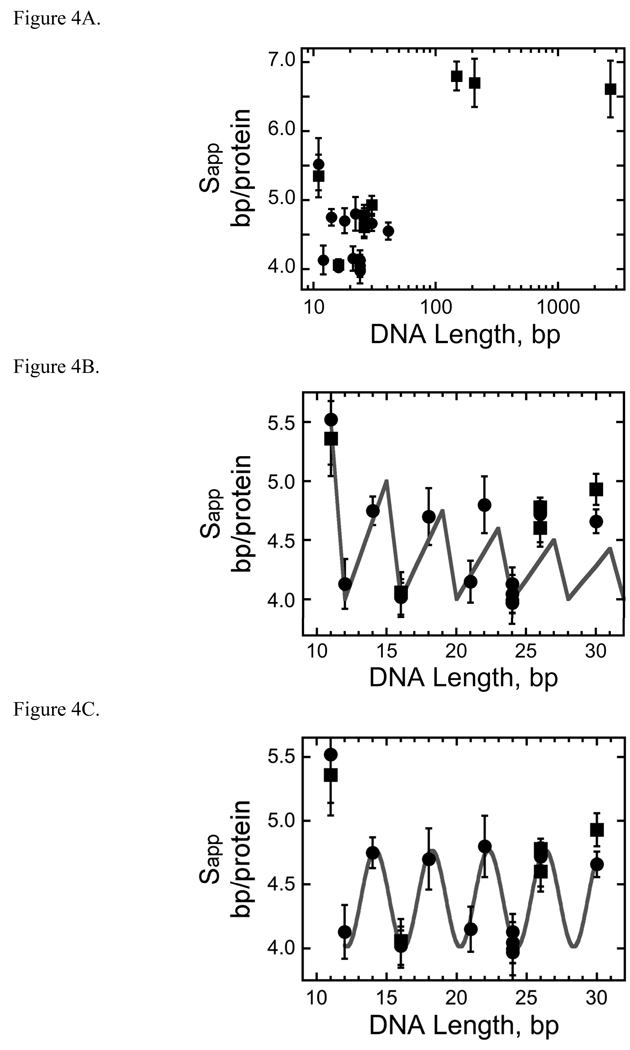
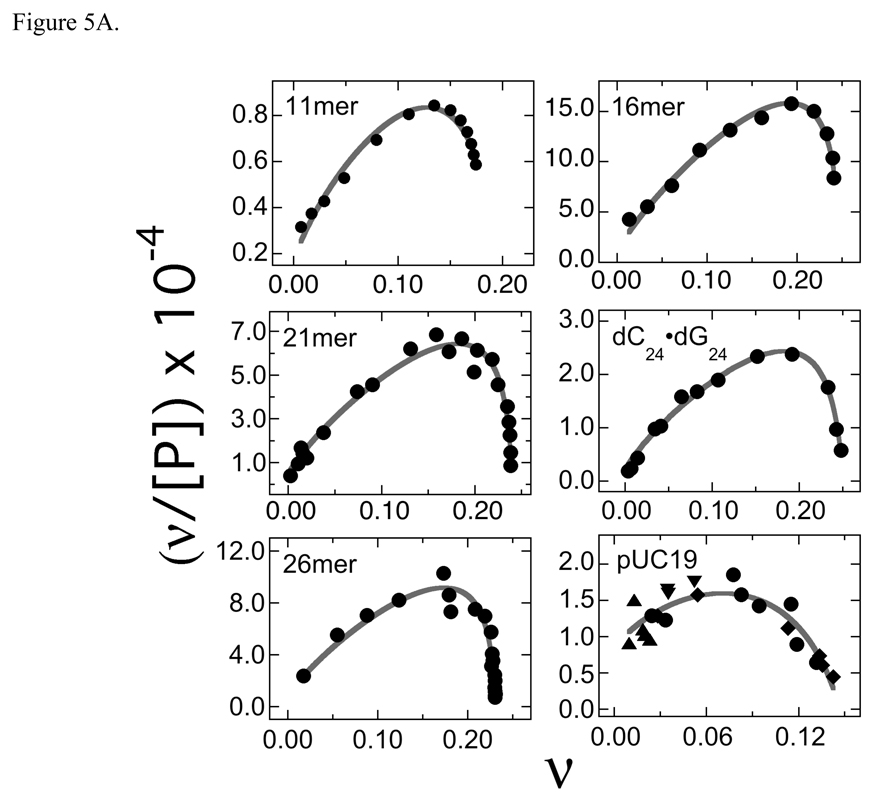
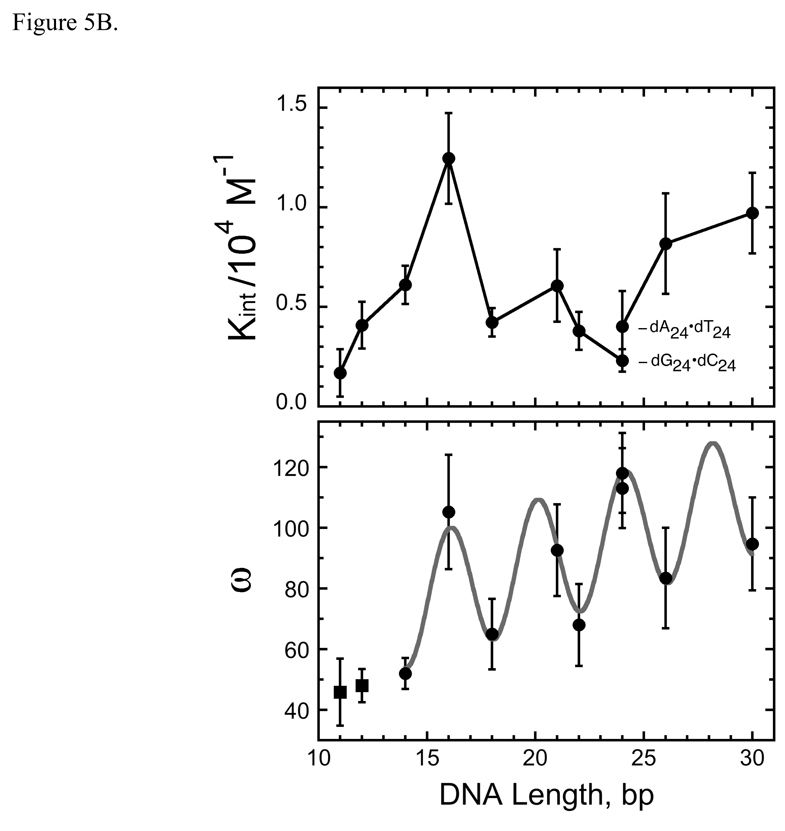
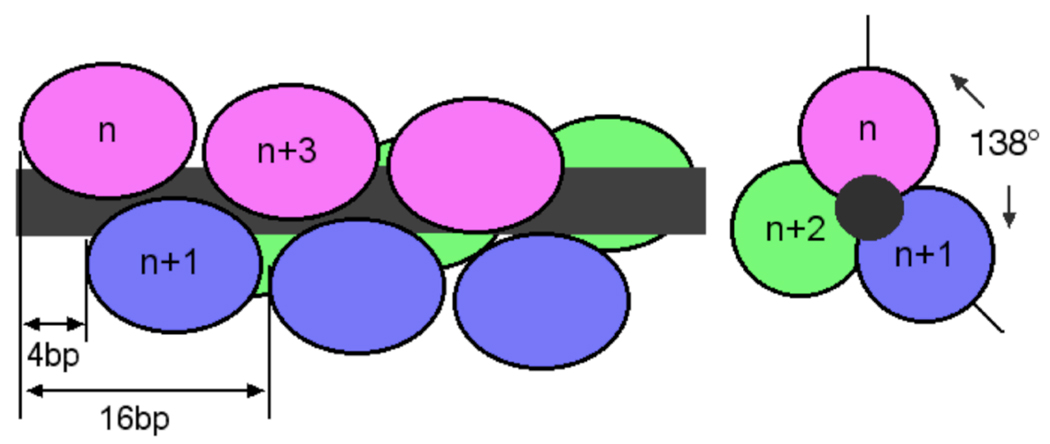
O(6)-alkylguanine-DNA alkyltransferase (AGT) is a ubiquitous enzyme with an amino acid sequence that is conserved in Eubacteria, Archaea, and Eukarya. It repairs O(6)-alkylguanine and O(4)-alkylthymine adducts in single-stranded and duplex DNAs. In performing these functions, AGT must partition between adduct-containing sites and the large excess of adduct-free DNA distributed throughout the genome. Here, we characterize the binding of human AGT to linear double-stranded, adduct-free DNAs ranging in length from 11 bp to 2686 bp. Moderately cooperative binding (22.6 +/- 3.7 < or = omega < or = 145.0 +/- 37.0) results in an all-or-nothing association pattern on short templates. The apparent binding site size S(app) (mean = 4.39 +/- 0.02 bp) oscillates with increasing template length. Oscillations in cooperativity factor omega have the same frequency but are of opposite phase to S(app), with the result that the most stable protein-protein and protein-DNA interactions occur at the highest packing densities. The oscillation period (4.05 +/- 0.02 bp/protein) is nearly identical to the occluded binding site size obtained at the highest measured binding density (4 bp/protein) and is significantly smaller than the contour length ( approximately 8 bp) occupied in crystalline complexes. A model in which protein molecules overlap along the DNA contour is proposed to account for these features. High AGT densities resulting from cooperative binding may allow efficient search for lesions in the context of chromatin remodeling and DNA replication.


Figures

Fig. 1
Fig. 1
Titration of representative double-stranded DNAs with human AGT. Upper panel: 11-mer duplex DNA, 8.8 × 10⁻⁷ M with [AGT] increasing from 0M to 6.5 × 10⁻⁵ M from left to right. Middle panel: 22-mer duplex DNA, 3.6 × 10⁻⁷ M, with [AGT] increasing from 0 M to 1.5 × 10⁻⁵ M from left to right. Lower panel: 26-mer duplex DNA, 3.9 × 10⁻⁷ M, with [AGT] increasing from 0 M to 4.8 × 10⁻⁵ M, from left to right. Binding reactions were carried out at 20 ± 1 °C and samples were resolved on 10% polyacrylamide gels, as described in Experimental Procedures. Band designations B, bound DNA; F, free DNA. Although these images have been cropped and labeled for clarity, no additional bands were detectable between the origin of electrophoresis and the ionic front.
Fig. 2
Fig. 2
Sedimentation equilibrium of solutions containing AGT and double-stranded DNAs at 20 ± 1 °C. Panel A: Representative data for binding to 26 bp DNA. Samples contained DNA (5 × 10⁻⁷ M) and AGT (1.45 × 10⁻⁵ M) in buffer consisting of 10 mM Tris (pH 7.6), 1 mM DTT, 1 mM EDTA, 100 mM NaCl. Radial scans taken at 20,000 rpm (■), 26,000 rpm (●), and 35,000 rpm (♦) are shown with vertical offsets for clarity. The smooth curves correspond to a global fit of Eq. 3 to a data set that includes these scans and scans obtained at 2 additional AGT concentrations (1.82 × 10⁻⁵ M and 2.18 × 10⁻⁵ M). The small residuals, nearly symmetrically-distributed about zero (upper panels) indicate that the cooperative nP + D ⇄ PnD model is consistent with the mass distributions of DNA in these samples, and that n = 5.65 ± 0.21. Panel B: Representative data for binding to linear pUC19 DNA (2686 bp). Samples contained DNA (5 × 10⁻⁷ M) and AGT in buffer consisting of 10 mM Tris (pH 7.6), 1 mM DTT, 1 mM EDTA, 100 mM NaCl. AGT concentrations were: 0M (●), 4.5 × 10⁻⁶ M (▼), 9.0 × 10⁻⁶ M (♦), 1.44 × 10⁻⁵ M (▲) and 2.16 × 10⁻⁵ M (■). Radial scans shown here were taken at 3,000 rpm. The smooth curves are fits of Eq. 5 to each data set.
Fig. 3
Fig. 3
Serial dilution analysis of the AGT complex formed with dA24•dT24. Panel A. Binding detected by EMSA. Sample a: 24-mer DNA (1.10 × 10⁻⁷ M) only. Sample b: 24-mer DNA (1.10 × 10⁻⁷ M) plus AGT (5.36 × 10⁻⁶ M). Samples c-l are sequential 1.33-fold dilutions of sample b. All samples were equilibrated in buffer consisting of 10mM Tris (pH 7.6), 100 mM NaCl, 1 mM DTT, 0.05 mg/mL bovine serum albumin for 30 min at 20 ± 1°C prior to resolution on native gels as described in Methods. Although this image has been cropped and labeled for clarity, no additional bands were detectable between the origin of electrophoresis and the ionic front. Panel B. Graph of the dependence of log[PnD]/[D] on log[P] for the AGT complex formed with dA24•dT24. Data from the experiment shown in Fig. 3A and others that provide additional [AGT] values. The line represents a least squares fit to the data ensemble for the range about the mid-point of the reaction (−6.18 ≤ log ([AGT]/M) ≤ −5.11), with [AGT]free calculated as described in Experimental Procedures. Symbols: the points used in the fit are indicated by (■) other points in the data set are indicated by closed circles (●). The slope equals 5.81 ± 0.34 for this subset of the data.
Fig. 4
Fig. 4
AGT forms a binding motif with a 4 bp periodicity. Panel A. Dependence of apparent binding site size (Sapp) on template length. Data from the entire set of AGT-dsDNA complexes. Sapp was calculated using Sapp = N/n, where N is DNA length in base pairs and n is the number of protein molecules bound to a DNA molecule. Sapp values determined from sedimentation equilibrium data are indicated by filled squares (■), values obtained from EMSA experiments are indicated by closed circles (●). The error bars correspond to 95% confidence limits. These data are also shown in Table 2. Panel B. Comparison of experimental and theoretical Sapp values as a function of DNA length. Experimental Sapp values determined from sedimentation equilibrium data are indicated by filled squares (■), values obtained from EMSA experiments are indicated by closed circles (●). The error bars correspond to 95% confidence limits. Theoretical Sapp values (solid line) were calculated using Sapp= N/nmax where nmax is the largest integer ≤ N/4. Panel C. Data for the subset of AGT-DNA complexes formed with DNAs of 41 bp or less. Data symbols are defined as in Panel A. The smooth curve is the least-squares fit of the equation Sapp = A cos (BL) + C in which A is the amplitude of the oscillation, B the displacement angle in degrees/bp and C is an offset equal to the mean value of Sapp. This fit returned A = −0.37 ± 0.04, B = 88.7 ± 0.5 degrees and C = 4.39 ± 0.02. This value of B indicates that successive binding sites are separated by 360/(88.7 ± 0.5) = 4.05 ± 0.02 bp along the DNA contour.
Fig. 5
Fig. 5
Analysis of binding affinities. Panel A: Scatchard plots. Forward titrations were carried out as described in Methods and binding was detected and quantitated by electrophoretic mobility shift assay. Each data set is a composite derived from 2 or 3 independent titrations. The smooth curves correspond to non-linear least squares fits of Eq. 2 to the data. The values of K and ω obtained as parameters of these fits are compiled in Table 2. Panel B: dependence of K and ω on DNA length (N). The data are derived in part from the experiments shown in Panel A. The error bars correspond to 95% confidence limits estimated for each parameter. K data for dA24-dT24 and dG24-dC24 templates are labeled Comparison with Fig. 4B shows that the oscillations of ω with increasing N have the same period but opposite phase as those of Sapp.
Fig. 5
Fig. 5
Analysis of binding affinities. Panel A: Scatchard plots. Forward titrations were carried out as described in Methods and binding was detected and quantitated by electrophoretic mobility shift assay. Each data set is a composite derived from 2 or 3 independent titrations. The smooth curves correspond to non-linear least squares fits of Eq. 2 to the data. The values of K and ω obtained as parameters of these fits are compiled in Table 2. Panel B: dependence of K and ω on DNA length (N). The data are derived in part from the experiments shown in Panel A. The error bars correspond to 95% confidence limits estimated for each parameter. K data for dA24-dT24 and dG24-dC24 templates are labeled Comparison with Fig. 4B shows that the oscillations of ω with increasing N have the same period but opposite phase as those of Sapp.
Fig. 6
Fig. 6
A model of binding topology for the cooperative array. Proteins are shown schematically as filled ovals and the DNA as a dark grey rod. Drawings are not to scale. Left, overlapping binding viewed from perpendicular to the DNA axis. Proteins are arranged as a three-start helix with individual arrays colored red, blue and green. Each protein is rotated ~138° with respect to its nearest neighbors, as predicted if all AGT molecules make identical contacts with the minor groove of B-form DNA and binding sites are separated by four base pairs. This view emphasizes the n-to-n+3 juxtaposition predicted for proteins along the same face of the DNA cylinder. Right: view down the long axis of the DNA. Only the first three proteins are shown for clarity. This view emphasizes the rotational juxtaposition of proteins n, n+1 and n+2.

References

    1. Loveless A. Nature (London) Vol. 223. 1969. Possible relevance of O6 alkylation of dexoyguanosine to he mutagenicity and carcinogenicity of nitrosamines and nitrosamides; pp. 206–207. - PubMed
    1. Pegg AE. Methylation of the O6 position of guanine in DNA is the most likely initiating event in carcinogenesis by methylating agents. Cancer Invest. 1984;2:223–231. - PubMed
    1. Pegg AE, Dolan ME, Moschel RC. Structure, function and inhibition of O6-alkylguanine-DNA alkyltransferase. Prog. Nucl. Acid Res. and Mol. Biol. 1995;51:167–223. - PubMed
    1. Pegg AE. Mammalian O6-alkylguanine-DNA alkyltransferase: regulation and importance in response to alkylating carcinogens and therapeutic agents. Cancer Res. 1990;50:6119–6129. - PubMed
    1. Margison GP, Santibáñez-Koref MF. O6-alkylguanine-DNA alkyltransferase: role in carcinogenesis and chemotherapy. BioEssays. 2002;24:255–266. - PubMed

Publication types