

Method of creating a nanopore-terminated probe for single-molecule enantiomer discrimination
- PMID: 19061410
- PMCID: PMC2642537
- DOI: 10.1021/ac802348r
Method of creating a nanopore-terminated probe for single-molecule enantiomer discrimination
Abstract
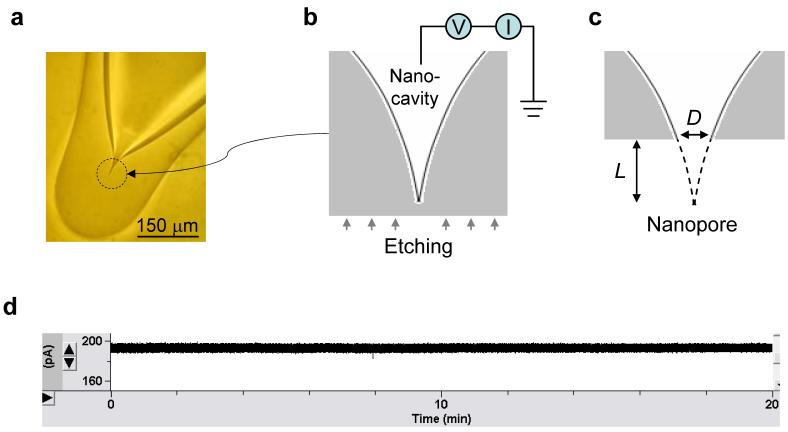
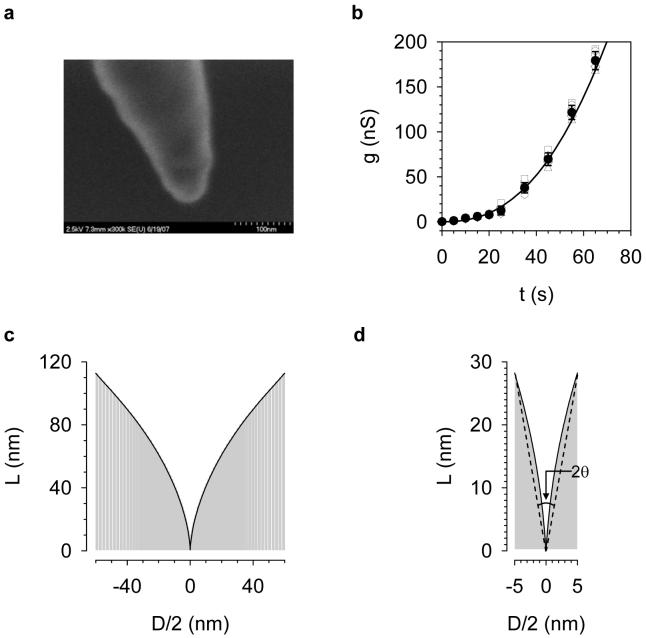
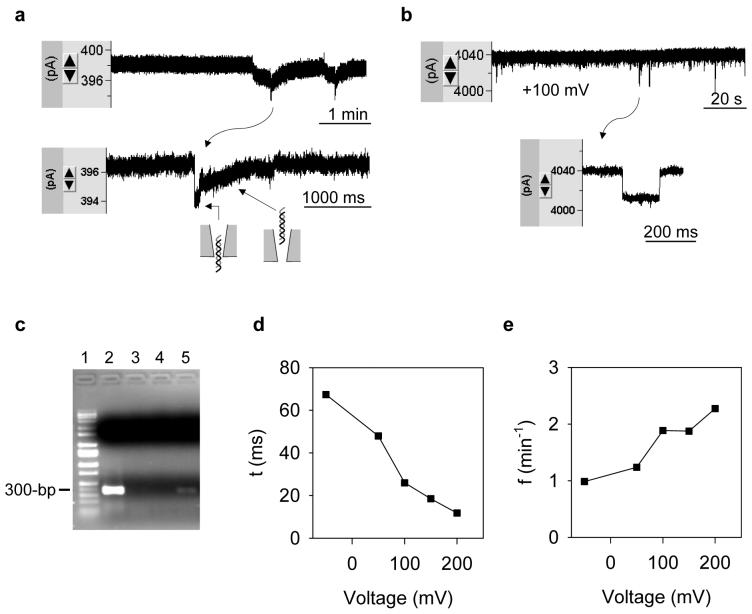
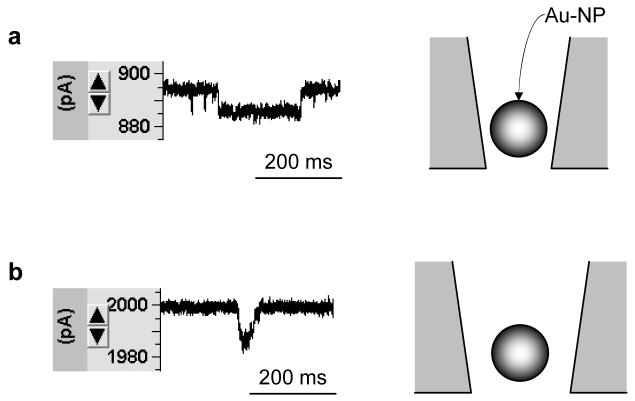
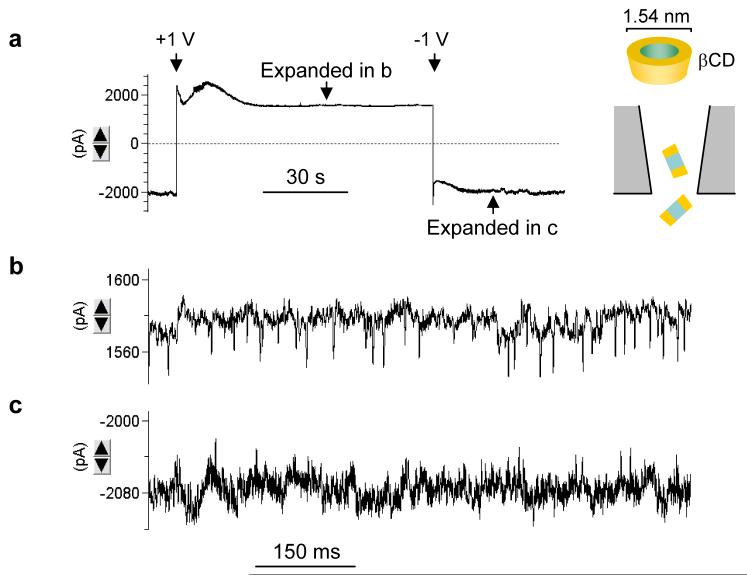
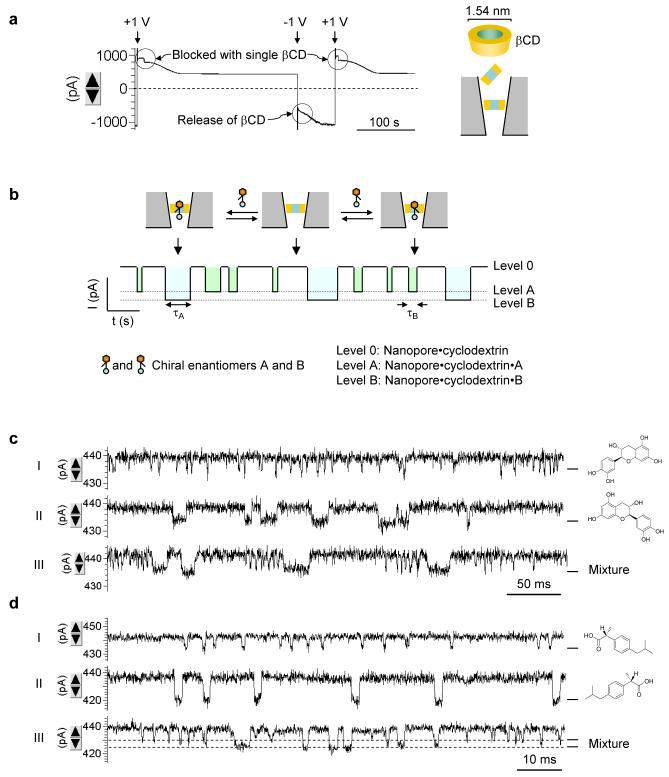
Nanopores are increasingly utilized as tools for single-molecule detection in biotechnology. Many nanopores are fabricated through procedures that require special materials, expensive facilities and experienced operators, which limit their usefulness on a wider scale. We have developed a simple method of fabricating a robust, low-noise nanopore by externally penetrating a nanocavity enclosed in the terminal of a capillary pipet. The nanocavity was shown to have a pore size on the scale of a single molecule, verified by translocation of molecules of known sizes, including double-stranded DNA (2 nm), gold nanoparticles (10 nm), and ring-shaped cyclodextrin (1.5 nm). The small pore size allows entrapment of a single cyclodextrin molecule. The glass nanopore with a trapped cyclodextrin proves useful in single-molecule discrimination of chiral enantiomers.
Figures
Similar articles
-
Single molecule sensing by nanopores and nanopore devices.Analyst. 2010 Mar;135(3):441-51. doi: 10.1039/b907735a. Epub 2009 Dec 22. Analyst. 2010. PMID: 20174694 Free PMC article. Review.
-
A novel open-tubular capillary electrochromatography using carboxymethyl-β-cyclodextrin functionalized gold nanoparticles as chiral stationary phase.J Sep Sci. 2020 Mar;43(5):946-953. doi: 10.1002/jssc.201900733. Epub 2019 Dec 27. J Sep Sci. 2020. PMID: 31802622
-
Templated assembly of DNA origami gold nanoparticle arrays on lithographically patterned surfaces.Methods Mol Biol. 2011;749:187-97. doi: 10.1007/978-1-61779-142-0_13. Methods Mol Biol. 2011. PMID: 21674373
-
Controllable Shrinking of Glass Capillary Nanopores Down to sub-10 nm by Wet-Chemical Silanization for Signal-Enhanced DNA Translocation.ACS Sens. 2017 Oct 27;2(10):1452-1457. doi: 10.1021/acssensors.7b00385. Epub 2017 Oct 17. ACS Sens. 2017. PMID: 28971672
-
Aptamer-encoded nanopore for ultrasensitive detection of bioterrorist agent ricin at single-molecule resolution.Annu Int Conf IEEE Eng Med Biol Soc. 2009;2009:6699-702. doi: 10.1109/IEMBS.2009.5333281. Annu Int Conf IEEE Eng Med Biol Soc. 2009. PMID: 19964179 Free PMC article. Review.
Cited by
-
Programming nanopore ion flow for encoded multiplex microRNA detection.ACS Nano. 2014 Apr 22;8(4):3444-50. doi: 10.1021/nn406339n. Epub 2014 Mar 26. ACS Nano. 2014. PMID: 24654890 Free PMC article.
-
Discrimination of supramolecular chirality using a protein nanopore.Chem Sci. 2017 Jul 1;8(7):5005-5009. doi: 10.1039/c7sc01940h. Epub 2017 May 11. Chem Sci. 2017. PMID: 28970887 Free PMC article.
-
Controllable Shrinking Fabrication of Solid-State Nanopores.Micromachines (Basel). 2022 Jun 10;13(6):923. doi: 10.3390/mi13060923. Micromachines (Basel). 2022. PMID: 35744537 Free PMC article. Review.
-
Nanopipettes as a Potential Diagnostic Tool for Selective Nanopore Detection of Biomolecules.Biosensors (Basel). 2024 Dec 19;14(12):627. doi: 10.3390/bios14120627. Biosensors (Basel). 2024. PMID: 39727892 Free PMC article. Review.
-
Nanopore Fabrication and Application as Biosensors in Neurodegenerative Diseases.Crit Rev Biomed Eng. 2020;48(1):29-62. doi: 10.1615/CritRevBiomedEng.2020033151. Crit Rev Biomed Eng. 2020. PMID: 32749118 Free PMC article. Review.
References
-
- Bayley H, Cremer PS. Nature. 2001;413:226–30. - PubMed
-
- Bezrukov SM, Vodyanoy I, Parsegian VA. Nature. 1994;370:279–81. - PubMed
-
- Gu LQ, Braha O, Conlan S, Cheley S, Bayley H. Nature. 1999;398:686–90. - PubMed
-
- Movileanu L, Howorka S, Braha O, Bayley H. Nature Biotechnology. 2000;18:1091–95. - PubMed
-
- Siwy Z, Trofin L, Kohli P, Baker LA, Trautmann C, Martin CR. Journal of the American Chemical Society. 2005;127:5000–01. - PubMed
Publication types
MeSH terms
Substances
Grants and funding
LinkOut - more resources
Full Text Sources
Other Literature Sources
