

A cross-species transcriptomics approach to identify genes involved in leaf development
- PMID: 19061504
- PMCID: PMC2621207
- DOI: 10.1186/1471-2164-9-589
A cross-species transcriptomics approach to identify genes involved in leaf development
Abstract
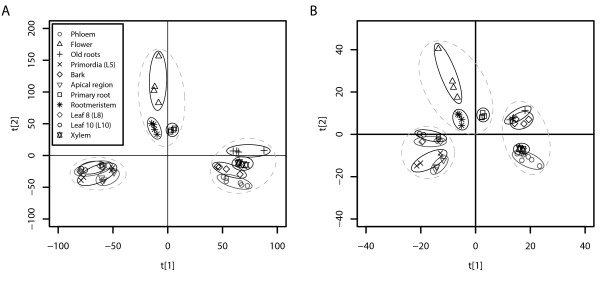
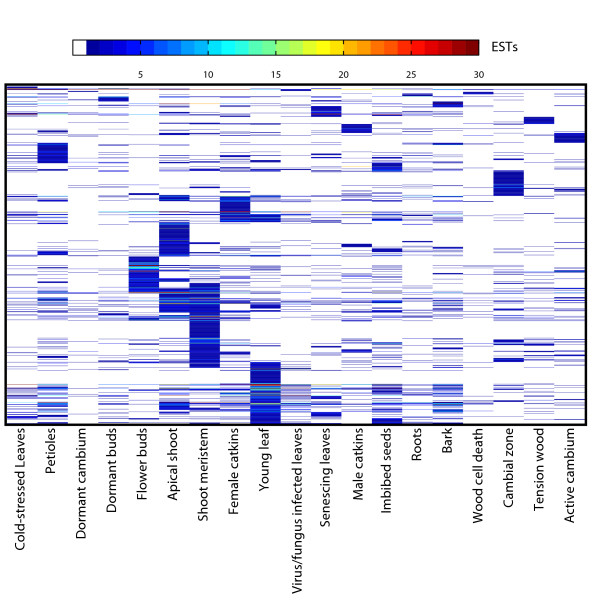
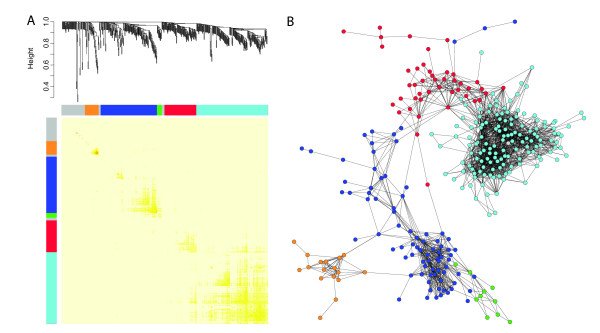
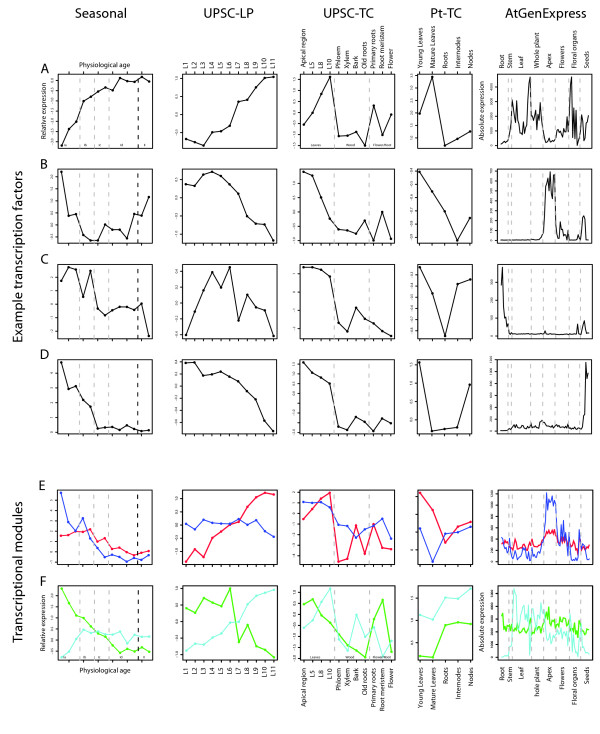
Background: We have made use of publicly available gene expression data to identify transcription factors and transcriptional modules (regulons) associated with leaf development in Populus. Different tissue types were compared to identify genes informative in the discrimination of leaf and non-leaf tissues. Transcriptional modules within this set of genes were identified in a much wider set of microarray data collected from leaves in a number of developmental, biotic, abiotic and transgenic experiments.
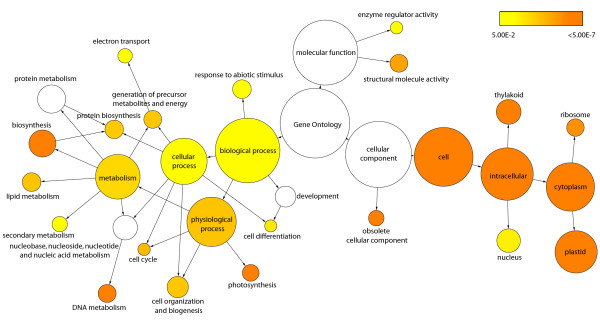
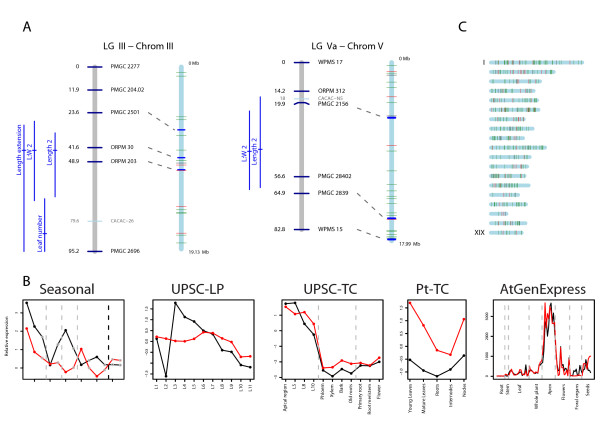
Results: Transcription factors that were over represented in leaf EST libraries and that were useful for discriminating leaves from other tissues were identified, revealing that the C2C2-YABBY, CCAAT-HAP3 and 5, MYB, and ZF-HD families are particularly important in leaves. The expression of transcriptional modules and transcription factors was examined across a number of experiments to select those that were particularly active during the early stages of leaf development. Two transcription factors were found to collocate to previously published Quantitative Trait Loci (QTL) for leaf length. We also found that miRNA family 396 may be important in the control of leaf development, with three members of the family collocating with clusters of leaf development QTL.
Conclusion: This work provides a set of candidate genes involved in the control and processes of leaf development. This resource can be used for a wide variety of purposes such as informing the selection of candidate genes for association mapping or for the selection of targets for reverse genetics studies to further understanding of the genetic control of leaf size and shape.
Figures
Similar articles
-
Comparative transcriptomics of drought responses in Populus: a meta-analysis of genome-wide expression profiling in mature leaves and root apices across two genotypes.BMC Genomics. 2010 Nov 12;11:630. doi: 10.1186/1471-2164-11-630. BMC Genomics. 2010. PMID: 21073700 Free PMC article.
-
Screening of Candidate Leaf Morphology Genes by Integration of QTL Mapping and RNA Sequencing Technologies in Oilseed Rape (Brassica napus L.).PLoS One. 2017 Jan 9;12(1):e0169641. doi: 10.1371/journal.pone.0169641. eCollection 2017. PLoS One. 2017. PMID: 28068426 Free PMC article.
-
Integrating genome annotation and QTL position to identify candidate genes for productivity, architecture and water-use efficiency in Populus spp.BMC Plant Biol. 2012 Sep 26;12:173. doi: 10.1186/1471-2229-12-173. BMC Plant Biol. 2012. PMID: 23013168 Free PMC article.
-
Transcriptome analyses of Populus x euramericana clone I-214 leaves exposed to excess zinc.Tree Physiol. 2011 Dec;31(12):1293-308. doi: 10.1093/treephys/tpr106. Epub 2011 Oct 27. Tree Physiol. 2011. PMID: 22038866
-
Transcription factors regulating leaf senescence in Arabidopsis thaliana.Plant Biol (Stuttg). 2008 Sep;10 Suppl 1:63-75. doi: 10.1111/j.1438-8677.2008.00088.x. Plant Biol (Stuttg). 2008. PMID: 18721312 Review.
Cited by
-
Comparative transcriptomics of drought responses in Populus: a meta-analysis of genome-wide expression profiling in mature leaves and root apices across two genotypes.BMC Genomics. 2010 Nov 12;11:630. doi: 10.1186/1471-2164-11-630. BMC Genomics. 2010. PMID: 21073700 Free PMC article.
-
A systems biology model of the regulatory network in Populus leaves reveals interacting regulators and conserved regulation.BMC Plant Biol. 2011 Jan 13;11:13. doi: 10.1186/1471-2229-11-13. BMC Plant Biol. 2011. PMID: 21232107 Free PMC article.
-
Zinc Finger-Homeodomain Transcriptional Factors (ZHDs) in Cucumber (Cucumis sativus L.): Identification, Evolution, Expression Profiles, and Function under Abiotic Stresses.Int J Mol Sci. 2024 Apr 17;25(8):4408. doi: 10.3390/ijms25084408. Int J Mol Sci. 2024. PMID: 38673993 Free PMC article.
-
Biotechnology Towards Energy Crops.Mol Biotechnol. 2016 Mar;58(3):149-58. doi: 10.1007/s12033-016-9913-6. Mol Biotechnol. 2016. PMID: 26798073
-
Storage products and transcriptional analysis of the endosperm of cultivated wheat and two wild wheat species.J Appl Genet. 2010;51(4):431-47. doi: 10.1007/BF03208873. J Appl Genet. 2010. PMID: 21063061
References
-
- Tsuge T, Tsukaya H, Uchimiya H. Two independent and polarized processes of cell elongation regulate leaf blade expansion in Arabidopsis thaliana (L.) Heynh. Development. 1996;122:1589–1600. - PubMed
Publication types
MeSH terms
Substances
LinkOut - more resources
Full Text Sources
Other Literature Sources
Research Materials
