. 2008 Dec 5;32(5):735-46.
doi: 10.1016/j.molcel.2008.11.012.

A genetic interaction map of RNA-processing factors reveals links between Sem1/Dss1-containing complexes and mRNA export and splicing

Affiliations

A genetic interaction map of RNA-processing factors reveals links between Sem1/Dss1-containing complexes and mRNA export and splicing

Gwendolyn M Wilmes et al. Mol Cell. .

Abstract

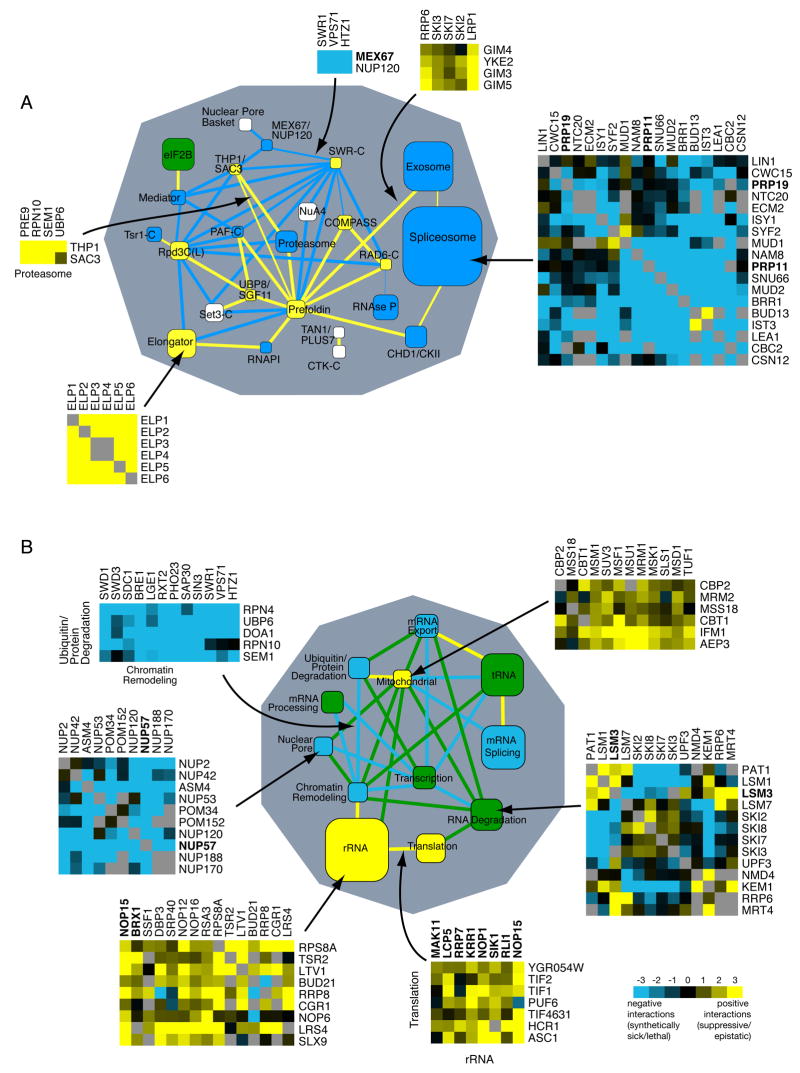
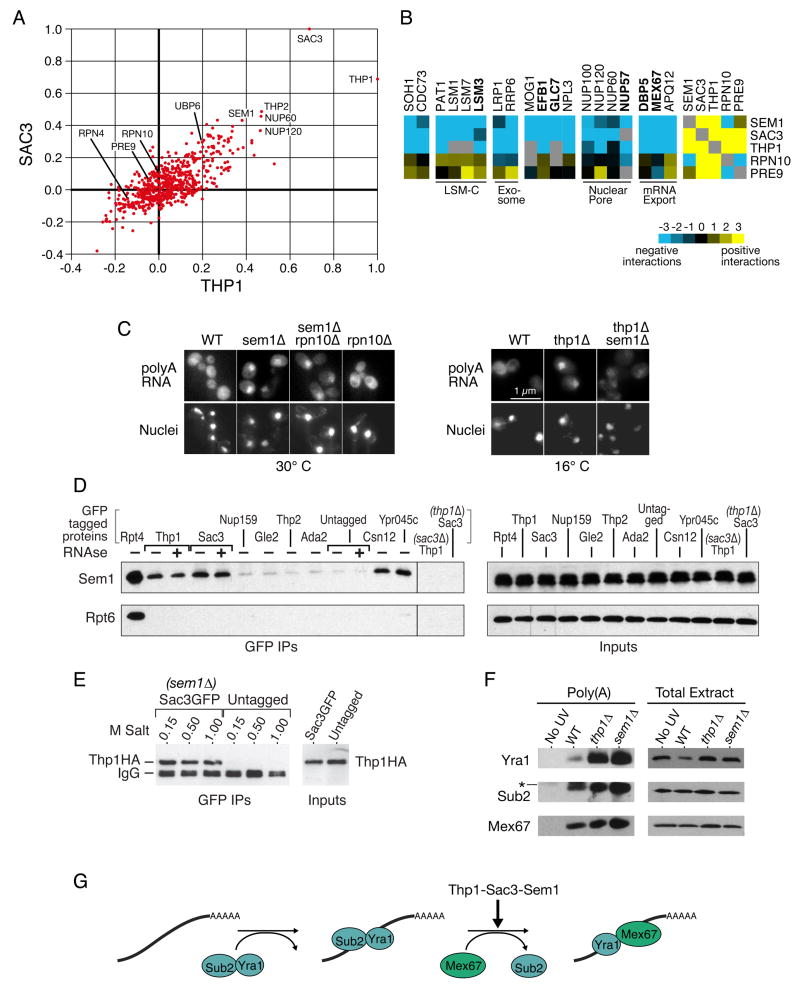
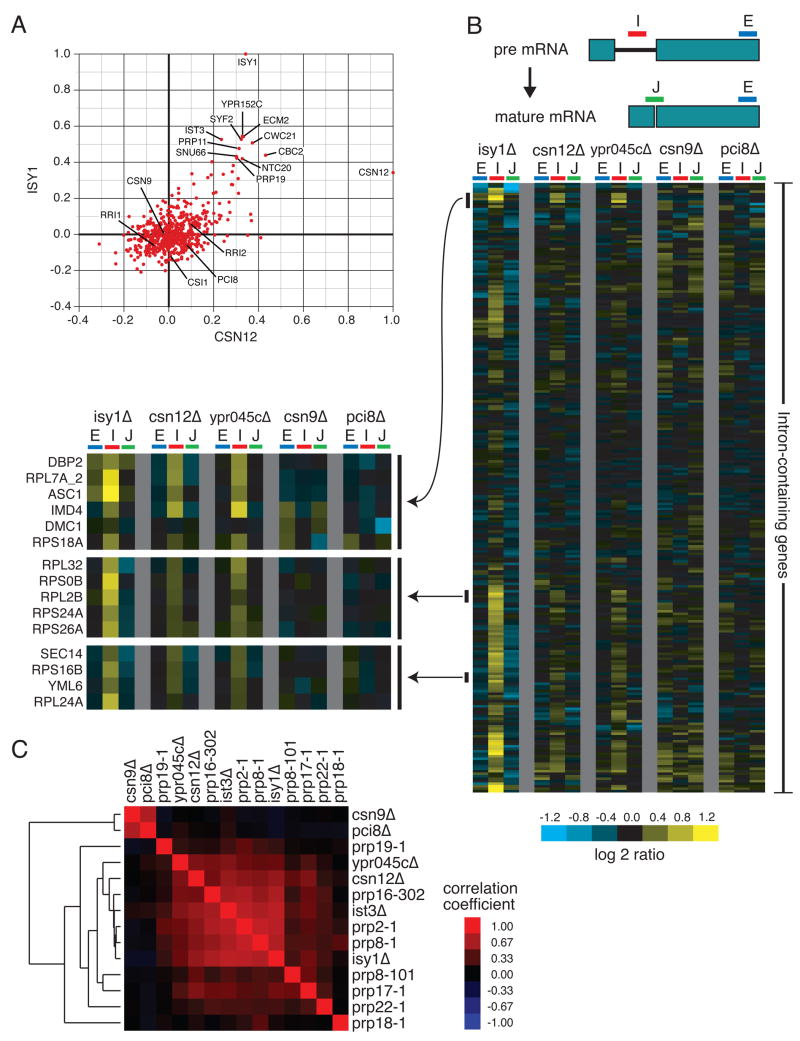
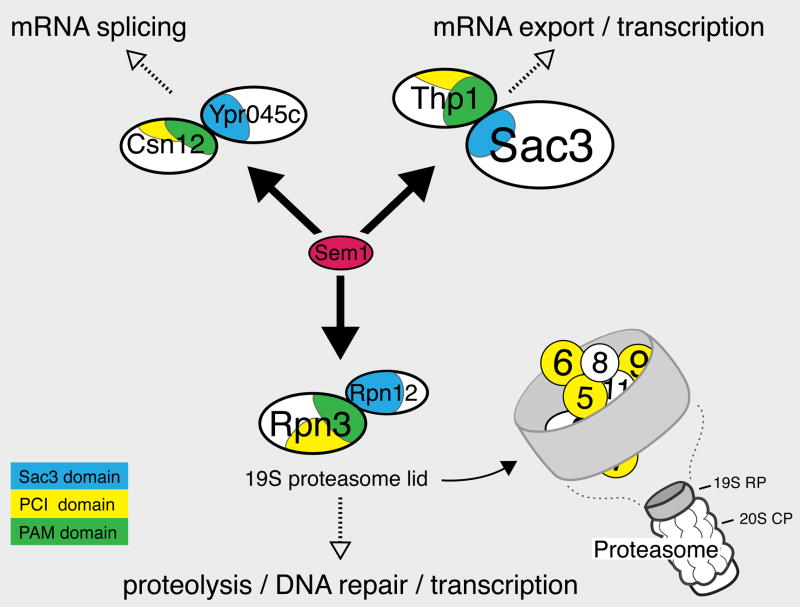
We used a quantitative, high-density genetic interaction map, or E-MAP (Epistatic MiniArray Profile), to interrogate the relationships within and between RNA-processing pathways. Due to their complexity and the essential roles of many of the components, these pathways have been difficult to functionally dissect. Here, we report the results for 107,155 individual interactions involving 552 mutations, 166 of which are hypomorphic alleles of essential genes. Our data enabled the discovery of links between components of the mRNA export and splicing machineries and Sem1/Dss1, a component of the 19S proteasome. In particular, we demonstrate that Sem1 has a proteasome-independent role in mRNA export as a functional component of the Sac3-Thp1 complex. Sem1 also interacts with Csn12, a component of the COP9 signalosome. Finally, we show that Csn12 plays a role in pre-mRNA splicing, which is independent of other signalosome components. Thus, Sem1 is involved in three separate and functionally distinct complexes.


Figures

Figure 1
Figure 1. Description of the RNA processing E-MAP
A) Composition of the RNA processing E-MAP. The dark red portions of the pie chart represent the proportions of the processes that correspond to essential genes. B) Comparison of genetic and physical interactions. The graph compares pairs of proteins that are physically associated (PE > 1.0, (Collins et al., 2007a)) and the genetic interaction scores from the corresponding mutants (S-score, (Collins et al., 2006)). C) Comparisons of ratios of negative (S ≤−2.5) to positive (S ≥2.0) (N to P) genetic interactions. The graph is divided into two parts: 1) all genetic interactions from the RNA processing E-MAP and 2) only those from pairs of genes whose corresponding proteins are physically associated (PE > 1.0, (Collins et al., 2007a)). Red bars correspond to genetic interactions derived entirely from deletions of pairs of non-essential genes (n= 58,879 total (left), 110 physically interacting (right)), while yellow bars are derived from pairs including one (n=48,741 total, 73 physically interacting) or two (n= 639 total, 4 physically interacting) DAmP alleles of essential genes. The overrepresentation of negative genetic interactions among pairs of genes that include an essential gene and have physical interactions was found to be highly significant using Fisher’s exact test, with a two-tailed p-value of 3×10⁻⁴. The trend was not strongly dependent on using various different thresholds for defining negative and positive interactions (data not shown). GIs, genetic interactions.
Figure 2
Figure 2. Functional cross-talk between biological processes and protein complexes
Global views of the genetic cross-talk between different RNA-related protein complexes (A) and processes (B). Blue and yellow represent a statistically significant enrichment of negative and positive interactions, respectively, whereas green corresponds to cases where there are roughly equal numbers of positive and negative genetic interactions. White corresponds to a lack of significant interactions or lack of data. Nodes (boxes) correspond to distinct protein complexes (A) or functional processes (B) whereas edges (lines) represent how the complexes and processes are genetically connected. Line thickness represents the significance of the connection. Node size is proportional to the number of genes in the process or complex. Essential genes (DAmP alleles) are in bold. Representative genetic interactions which contributed to the overall enrichment for interactions are shown for sample nodes and edges, according to the scale shown, with grey boxes representing missing data points. See Experimental Procedures for a description of how the networks are generated.
Figure 3
Figure 3. Sem1 is involved in mRNA export via the Sac3-Thp1 complex
A) Scatter plot of correlation coefficients for each mutant compared to the profiles generated from SAC3 (y-axis) and THP1 (x-axis). B) Representative genetic interactions from the E-MAP that differentiate SEM1, SAC3, and THP1 from RPN10 and PRE9. Blue and yellow indicate negative and positive genetic interactions, respectively. C) In situ hybridizations with a dT50 probe to detect accumulation of poly(A) RNA (top row). The bottom row is DAPI staining to detect nuclei. Cells were either kept at permissive temperature (30°C, left) or shifted to 16°C for 2 hours before fixation (right). D) Co-immunoprecipitations of Sem1 and Rpt6 with GFP-tagged proteins. The indicated strains were immunoprecipitated with a monoclonal GFP antibody, either with or without prior RNAse A treatment of the extract, and the blot was cut and probed with polyclonal antibodies against Sem1 or Rpt6. The right panel is 1/200th of the sample for the GFP IPs exposed identically to the left. E) Co-immunoprecipitations of Thp1-6HA with Sac3GFP in a sem1 Δ background. The immunoprecipitations were washed at room temperature with buffers containing the indicated amount of salt. The right panel represents1/20th the sample for the GFP IPS. F) In vivo UV crosslinking of proteins to poly(A) RNA. Each lane of the poly(A) eluates contains equal amounts of purified poly(A) RNA. The “no UV” strain contains Thp1-6HA. The * in the Sub2 blot represents a nonspecific cross-reacting band, which is resolved when the gels are run farther (see Supplemental Figure 4). The left and right panels were exposed differently, and the Yra1 poly(A) blot was overexposed to allow visualization of the Yra1 band in the wild-type strain. G) Depiction of the export block identified by the poly(A) crosslinking in part F. Sac3-Thp1-Sem1 could facilitate an exchange of Sub2 for Mex67. See text for more details.
Figure 4
Figure 4. Csn12 is involved in mRNA splicing
(A) Plot of correlation coefficients generated from comparison of the genetic interaction profiles from csn12Δ or isy1Δ to all other profiles in the E-MAP. B) Splicing-specific microarray profiles for several mutant strains. The schematic displays the positions of the microarray probes that report specifically on the levels of pre-mRNA (in the Intron), mature mRNA (at the Junction), and total mRNA (in the second Exon) for each intron-containing transcript. The relative levels of exon, intron, and junction for a single intron-containing gene are displayed as log2 ratios for the indicated mutant strains compared to a wild type strain, across each row. The ordering of genes was determined by hierarchical clustering. For selected clusters of genes, the splicing profiles across the mutants tested are displayed at higher resolution to the left of the full splicing profiles. C) Pairwise Pearson correlation coefficients were calculated between each of the mutants tested, as well as between these mutants and several previously characterized splicing mutants. The matrix of correlations was subjected to hierarchical clustering.
Figure 5
Figure 5. Model for three Sem1-containing complexes
19S RP= Regulatory Particle of the proteasome, which includes both the lid (diagrammed here), and the base. 20S CP= Core Particle of the proteasome. The schematic of protein organization in the proteasome lid is based on the model from Sharon et al (Sharon et al., 2006). The “SAC3” domains (PFAM PF03399) are amino acids: Rpn12 20–211, Ypr045c 205–408, and Sac3 248–443, and the PAM domains (Ciccarelli et al., 2003): Rpn3 204–378, Csn12 136–343, and Thp1 151–332. Also shown are the PCI domains (PFAM PF01399) associated with the PAM domains: Rpn3 343–447, Csn12 298–415, and Thp1 300–430.

References

    1. Baillat D, Hakimi MA, Naar AM, Shilatifard A, Cooch N, Shiekhattar R. Integrator, a multiprotein mediator of small nuclear RNA processing, associates with the C-terminal repeat of RNA polymerase II. Cell. 2005;123:265–276. - PubMed
    1. Bandyopadhyay S, Kelley R, Krogan NJ, Ideker T. Functional maps of protein complexes from quantitative genetic interaction data. PLoS Comput Biol. 2008;4:e1000065. - PMC - PubMed
    1. Becker RA, Chambers JM, Wilks AR. The new S language: a programming environment for data analysis and graphics. Pacific Grove, Calif.: Wadsworth & Brooks/Cole Advanced Books & Software; 1988.
    1. Brickner DG, Cajigas I, Fondufe-Mittendorf Y, Ahmed S, Lee PC, Widom J, Brickner JH. H2A.Z-mediated localization of genes at the nuclear periphery confers epigenetic memory of previous transcriptional state. PLoS Biol. 2007;5:e81. - PMC - PubMed
    1. Chan SP, Kao DI, Tsai WY, Cheng SC. The Prp19p-associated complex in spliceosome activation. Science. 2003;302:279–282. - PubMed

Publication types

MeSH terms