. 2008 Dec 9;14(6):458-70.
doi: 10.1016/j.ccr.2008.11.003.

Akt determines replicative senescence and oxidative or oncogenic premature senescence and sensitizes cells to oxidative apoptosis

Affiliations

Akt determines replicative senescence and oxidative or oncogenic premature senescence and sensitizes cells to oxidative apoptosis

Veronique Nogueira et al. Cancer Cell. .

Abstract

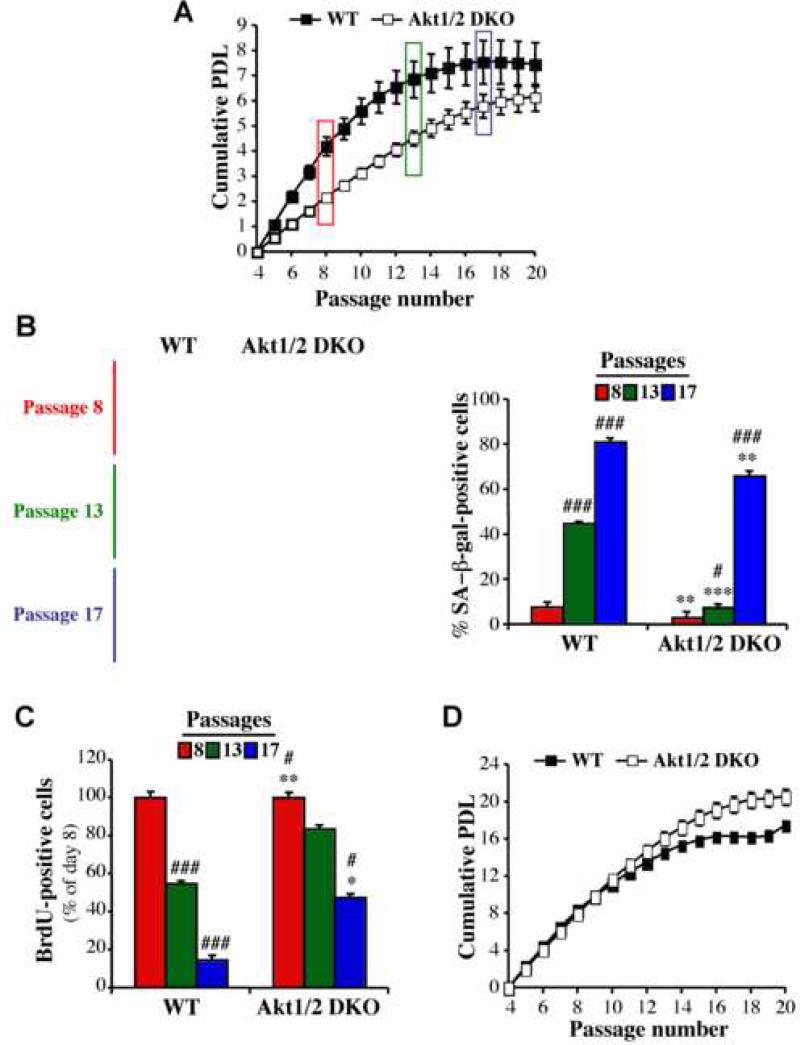
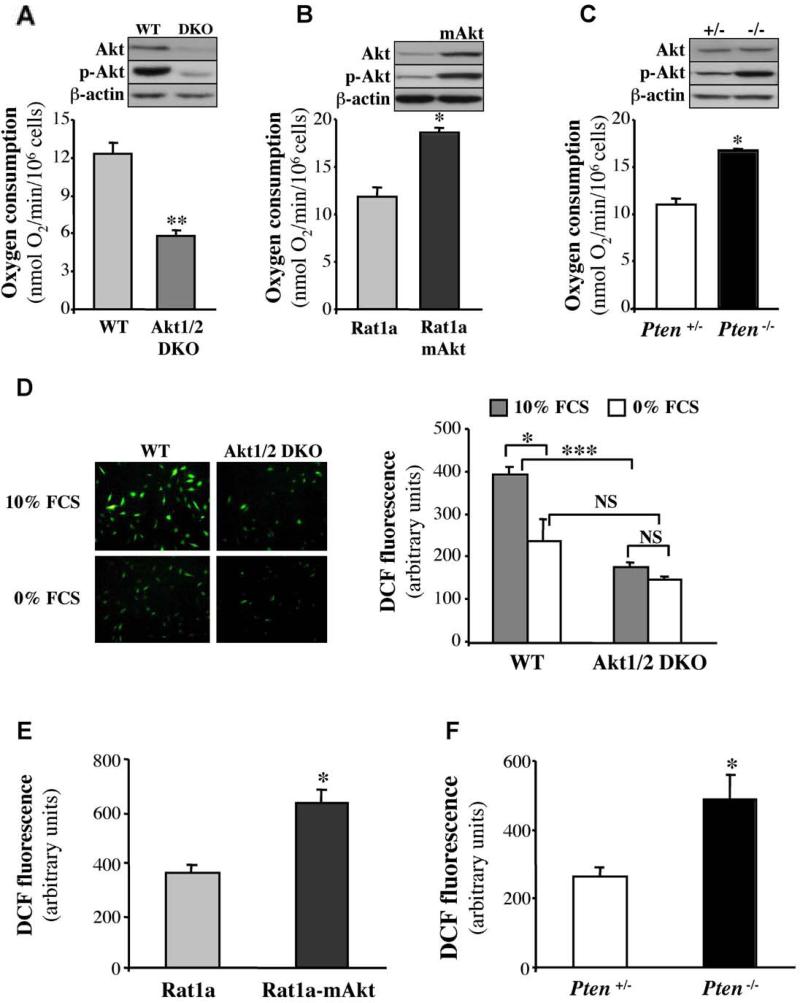
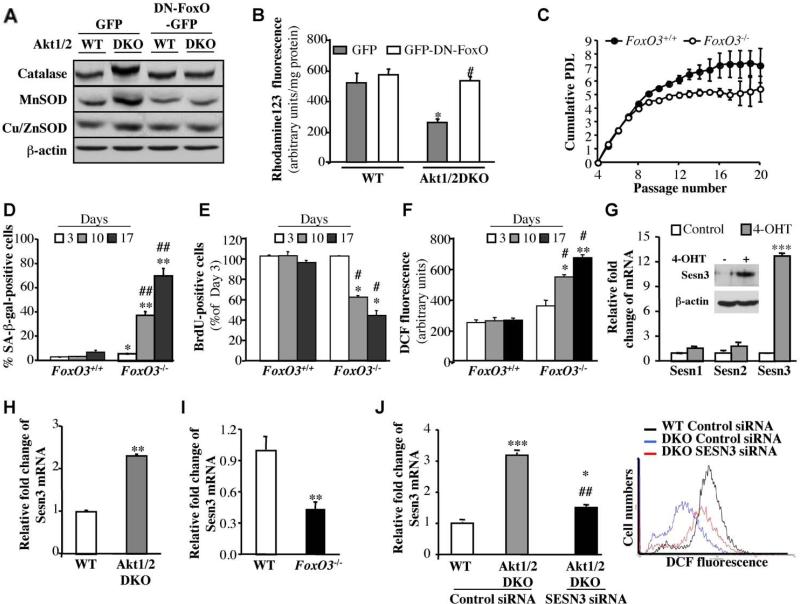
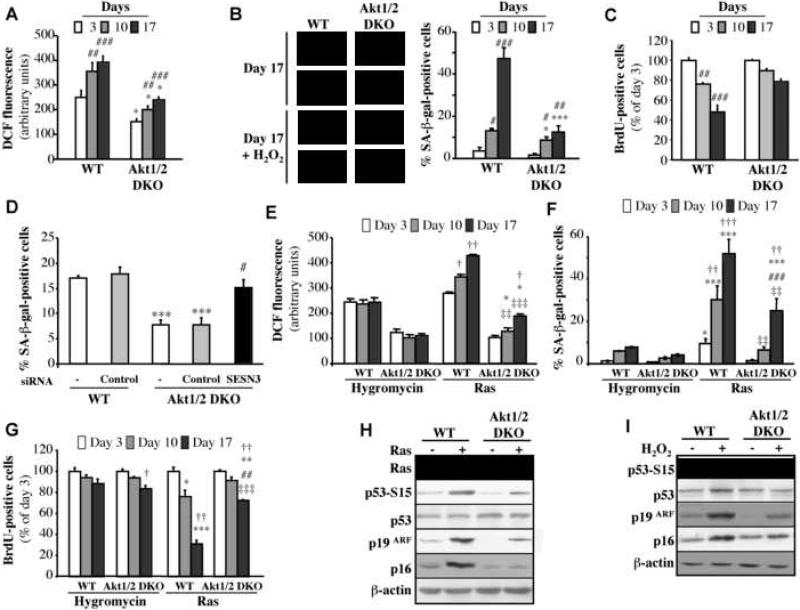
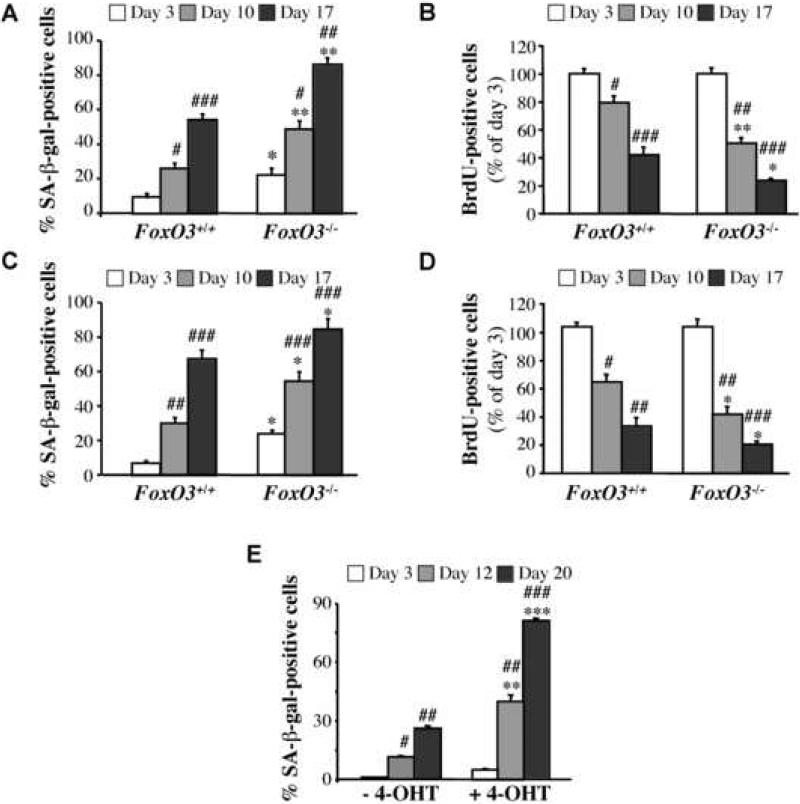
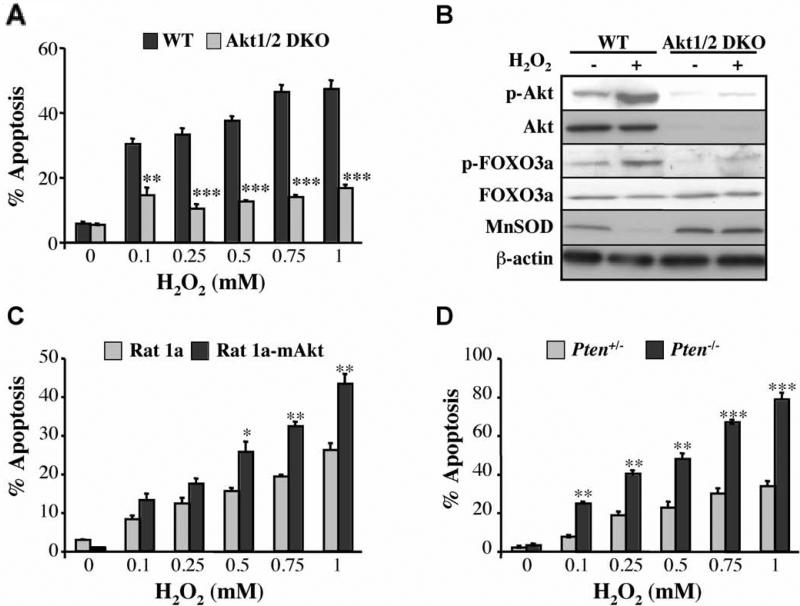
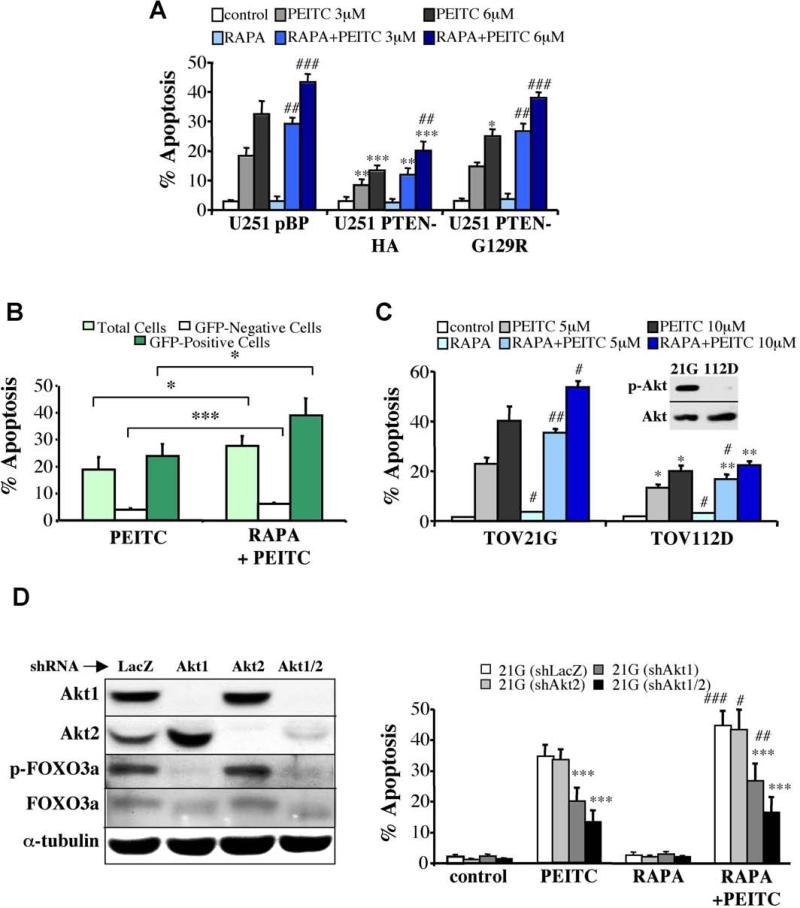
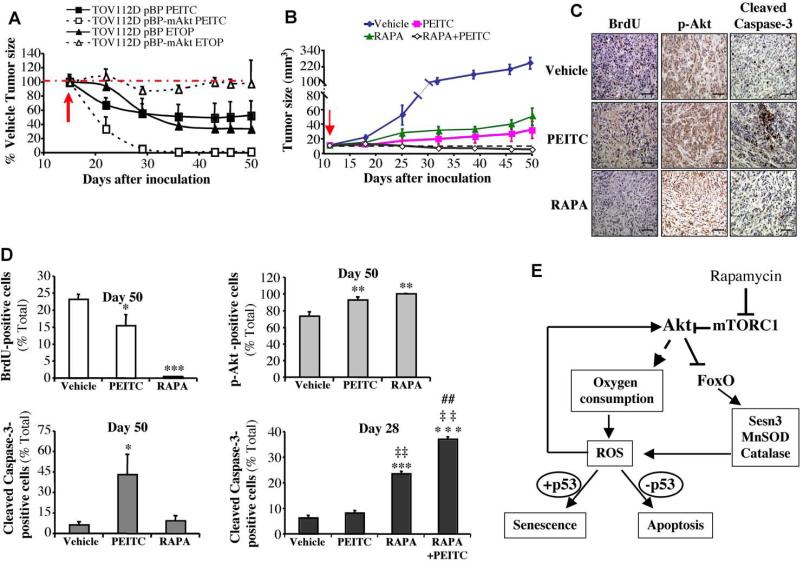
Akt deficiency causes resistance to replicative senescence, to oxidative stress- and oncogenic Ras-induced premature senescence, and to reactive oxygen species (ROS)-mediated apoptosis. Akt activation induces premature senescence and sensitizes cells to ROS-mediated apoptosis by increasing intracellular ROS through increased oxygen consumption and by inhibiting the expression of ROS scavengers downstream of FoxO, particularly sestrin 3. This uncovers an Achilles' heel of Akt, since in contrast to its ability to inhibit apoptosis induced by multiple apoptotic stimuli, Akt could not inhibit ROS-mediated apoptosis. Furthermore, treatment with rapamycin that led to further Akt activation and resistance to etoposide hypersensitized cancer cells to ROS-mediated apoptosis. Given that rapamycin alone is mainly cytostatic, this constitutes a strategy for cancer therapy that selectively eradicates cancer cells via Akt activation.


Figures

Figure 1
Figure 1. Akt regulates replicative senescence
A. Cells were subjected to the 3T3 protocol as described in Experimental Procedures. Cells were counted at each passage every 3 days, and the population doubling (PDL) was calculated for wild-type (WT) and Akt1/2 null (Akt1/2 DKO) primary MEFs. B. Primary MEFs were stained for SA-β-gal activity at passage 8 (before visible signs of senescence), at passage 13 when WT cells began to exhibit proliferative arrest, and at passage 17 when Akt1/2 DKO cells began to exhibit proliferative arrest. Left Panels: representative photographic images of cells stained for SA-β-gal activity at passage number 8, 13 and 17. Right panel: SA-β-gal-positive cells were counted in at least 5 fields of triplicate plates. Data represent the mean ± S.E.M. of three independent experiments. *, **, p<0.05, 0.01 vs. WT. #, ###, p<0.05, 0.001 vs. Passage 8. C. Proliferation rate of primary MEFs as measured by BrdU labeling for 24 hr prior to fixation and staining. BrdU incorporation was carried out as described in the Experimental Procedures and determined by counting at least 150 cells from at least 5 fields in triplicate plates. Data represent the mean ± S.E.M. of three independent experiments. *,**, *** p<0.05, 0.01, 0.001 vs. WT. #, ###, p<0.05, 0.001 vs. Passage 8. D. Cumulative PDL of WT and Akt1/2 DKO primary MEFs as described in (A) except that cells were split and counted every 5 days. Data represent the mean ± S.E.M. of at least three independent experiments.
Figure 2
Figure 2. Akt regulates oxygen consumption and ROS generation
A-C. Rates of oxygen consumption in WT or Akt1/2 DKO MEFs (A), Rat1a, or Rat1a expressing activated Akt (Rat1a mAkt) (B), and Pten+/- or Pten-/- MEFs (C) were measured as described in Experimental Procedures. Immunoblots show the relative level of phosphorylated Akt (p-Akt Ser 473) and total Akt in all cell lines. Data represent the mean ± S.E.M. of at least three independent experiments. *, ** p<0.05, 0.01 vs. WT (A), Rat1a (B) and PTEN+/- (C). D-F. Akt mediates the generation of ROS. D. Levels of ROS in WT and Akt1/2 DKO MEFs incubated in 10% FBS or in 0% FBS overnight. Left panels: representative images of cells stained with DCF. Right panel: quantification of ROS levels. *, P < 0.05; ***, P < 0.001; NS, not significant. E. Levels of ROS in Rat1a and Rat1a-mAkt cells. F. Level of ROS in Pten+/- and Pten-/- MEFs. Data are expressed as arbitrary units after being normalized to protein concentration. All data represent the mean ± S.E.M. of at least three independent experiments. *, p<0.05 vs. Rat1a (E) or Pten+/- (F).
Figure 3
Figure 3. FoxO transcription factors regulate the generation of ROS and replicative senescence downstream of Akt
A. Catalase and MnSOD are upregulated in Akt1/2 DKO MEFs, and are downregulated by DN-FoxO. The generation of cells expressing DN-FOXO is described in Experimental Procedures. Proteins extracted from exponentially growing DNp53-immortalized WT and Akt1/2 DKO MEFs overexpressing GFP (control vector) or DN-FOXO-GFP were subjected to immunoblotting using antibodies specific for catalase, MnSOD, Cu/ZnSOD and β actin as a loading control. B. DN-FOXO restores intracellular level of ROS in Akt1/2 DKO cells. Quantification of ROS in WT and Akt1/2 DKO MEFs overexpressing GFP or DN-FOXO-GFP after incubation of cells with rhodamine123 as a sensor of ROS production (described in Experimental Procedures). Data represent the mean ± S.E.M. of three independent experiments. *, p<0.05 vs. GFP-WT. #, p<0.05 vs. GFPAkt1/2 DKO. C. Wild-type (FOXO3+/+) and FOXO3 null (FOXO3-/-) primary MEFs were analyzed for replicative senescence using the 3T3 protocol. Cumulative PDL is plotted against Passage Number. Data represent the mean ± S.E.M. of three independent experiments. D. SA-β-gal activity in primary FOXO3+/+ and FOXO3-/- cells. Assay was performed at 3, 10 and 17 days in culture. *, **, p<0.05, 0.01 vs. FOXO3+/+, ##, p<0.01 vs. Day 3. E. Cell proliferation was assessed by BrdU incorporation at the same time points shown in (D). *, p<0.05 vs. FOXO3+/+, #, p<0.05 vs. Day 3. Data represent the mean ± S.E.M. of three independent experiments. F. Level of ROS in primary FOXO3+/+ and FOXO3-/- cells at the same time points as in (D). Data are presented as arbitrary units after being normalized to protein concentration. *, **, p<0.05, 0.01 vs. FOXO3+/+, #, p<0.05 vs. Day 3. Data represent the mean ± S.E.M. of at least three independent experiments. G. Left panel. Level of Sestrin 1, 2 and 3 mRNA as determined by quantitative RT-PCR. Wild type MEFs immortalized with DN-p53 and stably expressing FoxO1AAA-ER were treated with 4-OHT followed by RNA analysis as described in Experimental Procedures. ***, p<0.001 vs. control. Right panel. Immunoblot showing induction of Sesn3 protein level after FoxO1AAA-ER activation by 4-OHT. H. Level of Sestrin 3 mRNA in WT and Akt1/2 DKO MEFs, immortalized with DN-p53, as assessed by quantitative RT-PCR. **, p<0.01 vs. WT. I. Level of Sestrin 3 mRNA in WT and FOXO3-/- MEFs immortalized with DN-p53. All RNA analyses were done in triplicates. **, p<0.001 vs. WT. J. The knockdown of Sesn3 in Akt1/2 DKO MEFs elevates ROS levels to that in WT cells. Left panel: Levels of Sesn3 mRNA in WT, Akt1/2 DKO and Akt1/2 DKO-Sesn3 KD MEFs as assessed by quantitative RT-PCR. *, ***, p<0.05, 0.001 vs. control siRNA in WT and ##, p<0.01 vs. control siRNA in Akt1/2 DKO. Data represent the mean ± S.E.M. of three independent experiments. Right panel: Levels of ROS in WT, Akt1/2 DKO and Akt1/2 DKO-SESN3 KD MEFs as assessed by DCF fluorescence.
Figure 4
Figure 4. Akt deficiency exerts resistance to H2O2- and Ras-induced premature senescence
Premature senescence of primary WT and Akt1/2 DKO MEFs was induced with 75 μM H2O2 as described in Experimental Procedures. At days 3, 10 and 17 after treatment cells were analyzed for: A. ROS production B. SA-β-gal activity (Left Panels: representative images of cells stained for F-actin/DAPI (fluorescence) and SA-β-gal activity (brightfield) at Day 17. Right panel: β-gal-positive cells. C. BrdU incorporation. *, ***, p<0.05, 0.001 vs. WT and ##, ###, p<0.01, 0.001 vs. Day 3. D. The knockdown of Sesn3 overrides the resistance of Akt1/2 DKO MEFs to H2O2-induced senescence. Premature senescence of primary WT and Akt1/2 DKO MEFs was induced with 75 μM H2O2 as described in Experimental Procedures, and at day 0, cells were transfected with siRNAs and then cells were analyzed for SA-β-gal activity at day 7 post transfection. *** p<0.001 vs. WT; # p<0.05 vs. Akt1/2 DKO. E-G. Primary WT and Akt1/2 DKO MEFs were infected with empty vector (Hygromycin) or H-Rasval12-expressing retroviruses. At days 3, 10 and 17 post selection (see Experimental Procedures), the cells were analyzed for: E, ROS production; F, SA-β-gal activity; and G, BrdU incorporation. *, **, *** p<0.05, 0.01, 0.001 vs. WT-Hygro; ##, ### p<0.01, 0.001 vs. Akt1/2 DKO-Hygro; ‡‡, ‡‡‡ p<0.01, 0.001 vs. WT-Ras; †, ††, ††† p<0.05, 0.01, 0.001 vs. Day 3. H. Immunoblot showing expression of Ras, showing p53 phospho-Ser15, total p53, p19ARF, and p16 following expression of H-Rasv12 in wild-type or Akt1/2 DKO MEFs. I. Immunoblot showing p53 phospho-Ser15, total p53, p19ARF, and p16 following addition of H2O2 to wild-type or Akt1/2 DKO MEFs. All data represent the mean ± S.E.M. of at least three independent experiments.
Figure 5
Figure 5. FoxO3-/- MEFs are sensitized to H2O2 and Ras induced premature senescence
(A-D). Primary FoxO3+/+ and FoxO3-/- MEFs were treated with 75μM H2O2. At days 3, 10 and 17-post treatment, cells were analyzed for: A, SA-β-gal activity; and B, BrdU incorporation. Primary FoxO3+/+ and FoxO3-/- MEFs were infected with retrovirus expressing H-Rasv12. At days 3, 10 and 17 post selection, cells were analyzed for: C, SA-β-gal activity; and D, BrdU incorporation. All data represent the mean ± S.E.M. of at least three independent experiments. *,** p<0.05, 0.01 vs. FOXO3+/+; #, ##, ### p<0.05, 0.01, 0.001 vs. Day 3. E. Activated Akt induces premature senescence of MEFs. Primary wild-type MEFs were infected with retrovirus expressing inducible myristoylated Akt (mAkt-ER). After selection, cells were either untreated or treated with 4-OHT. At days 3, 12 and 20-post incubation with 4-OHT, cells were analyzed for SA-β-gal activity. Data represent the mean ± S.E.M. of at least three independent experiments. **, *** p<0.01, 0.001 vs. vehicle control; #,##, ### p<0.05, 0.01, 0.001 vs. Day 3.
Figure 6
Figure 6. Akt sensitizes cells to oxidative stress mediated apoptosis in a FoxO-dependent manner
A. Akt deficiency exerts resistance to oxidative stress induced apoptosis. DNp53-immortalized WT and Akt1/2 DKO MEFs were treated with increasing concentrations of H2O2 (0.1–1 mM) for 2 h, and apoptosis was quantified by DAPI staining. **, *** p<0.01, 0.001 vs. WT. B. Oxidative stress increases the phosphorylation of Akt and FoxO and reduces the expression of MnSOD. DNp53-immortalized WT and Akt1/2 DKO MEFs were treated with 500 μM H2O2 for 10 min, rinsed and then incubated for 2 h prior to cell lysate preparation. The immunoblot shows levels of phosphorylated Akt (Ser473) and FOXO3a (Ser253), total Akt, FOXO3a, MnSOD, and β-actin as a loading control. C, D. Activation of Akt sensitizes the cells to H2O2-induced cell death. Apoptosis after treatment of Rat1a or Rat1a-mAkt cells with increasing concentrations of H2O2 for 2 h. *, ** p<0.05, 0.01 vs. Rat1a. D. Apoptosis after treatment of Pten+/- or Pten-/- MEFs with increasing concentrations of H2O2 for 2 h. **, *** p<0.01, 0.001 vs. PTEN+/-. All data represent the mean ± S.E.M. of three independent experiments.
Figure 7
Figure 7. Rapamycin sensitizes cells to PEITC–induced apoptosis in an Akt-dependent manner
A. Pten-deficient, U251 glioblastoma or U251 cells expressing G129R PTEN mutant, are more sensitive to PEITC-induced apoptosis than U251 cells expressing WT PTEN. Rapamycin sensitizes U251 as well as U251-PTEN cells to PEITC-induced apoptosis. *, **, *** p<0.05, 0.01, 0.001 vs. control cells (U251 pBP); ##, ### p<0.01, 0.001 vs. PEITC in the absence of RAPA. B. Preferential killing of cells expressing activated Akt by the combination of rapamycin and PEITC. A mixed population of Rat1a (45.60% ± 1.30% of total cells) and Rat1a-mAktGFP (53.48% ± 1.33% of total cells) was treated with 6 μM PEITC for 6 h after preincubation with 100 nM rapamycin for 3 h. Following incubation, cells were collected and subjected to flow cytometry to assess cell death, as described in Experimental Procedures. The percentage of cell death was calculated within each cell population and is presented as the mean ± S.E.M. of at least three independent experiments, * p<0.05, and *** p<0.001. C. The combination of rapamycin and PEITC preferentially induces apoptosis in ovarian cancer cells with hyperactive Akt. Ovarian cancer TOV21G and TOV112D cells were preincubated with 100 nM rapamycin for 3 h before treatment for 17 h with 5 or 10 μM PEITC. Apoptosis was then assessed by DAPI staining. Data represent the mean ± S.E.M. of at least three independent experiments. Insert shows an immunoblot probed with anti-pSer473 of Akt and with anti-pan Akt in a protein extract from serum-deprived TOV21G or TOV112D cells. *, ** p<0.05, 0.01 vs. TOV21G; #, ## p<0.05, 0.01 vs. PEITC in the absence of RAPA. D. The knockdown of Akt isoforms reduces the susceptibility of TOV21G to apoptosis induced by the combination of rapamycin and PEITC. Left panel: Expression of Akt1 and Akt2 and total Akt activity as measured by FOXO3a phosphorylation in control shLacZ, shAkt1, shAkt2, and shAkt1+shAkt2 TOV21G-expressing cell lines. Right panel: Quantification of apoptosis induced by rapamycin + PEITC in the different knocked down cells, presented as the mean ± S.E.M. of at least three independent experiments. ***, p<0.001 vs. TOV21G (sh-LacZ); #, ##, ### p<0.05, 0.01, 0.001 vs PEITC in the absence of RAPA.
Figure 8
Figure 8. In vivo therapeutic activities of PEITC, and PEITC combined with rapamycin
A. In vivo therapeutic activity of PEITC, compared to etoposide, in mice inoculated with TOV112D ovarian cancer cells or TOV112D (mAkt) cells. Forty two nude mice were injected subcutaneously on both left and right flanks with TOV112D or TOV112D (mAkt) cells, and randomly divided into 3 groups per cell line (14 mice/group, 28 tumors/group) for treatment with PEITC, Etoposide (ETOP) or solvent control. Graph presents the evolution of tumor size respective to the treatment and relative to the control mice. Red arrow indicates the beginning day of the treatment (day 13-post inoculation of the tumor cells). B. In vivo therapeutic effect of Rapamycin + PEITC in mice inoculated with TOV21G ovarian cancer cells. Thirty six nude mice were injected subcutaneously on both left and right flanks with TOV21G cells and randomly divided into 4 groups (9 mice/group, 18 tumors/group) for treatment with PEITC, Rapamycin (RAPA), combination of RAPA/PEITC or solvent as a control. Graph presents tumor growth rate in each group. Red arrow indicates the starting day of the treatment (day 13-post inoculation of the tumor cells). C. Cross sections of tumors collected from the experiment described in B. At day 50-post tumor cells inoculation, cross sections of tumors were subjected to BrdU staining (Left panels), staining with anti-pAkt (Middle panels), and staining with anti-cleaved caspase-3 (Right panels). Scale bar; 40μm. D. Histograms showing the quantification of the positively stained cells in C, and for cleaved caspase-3 staining in tumor sections collected 28 days after inoculation. Results are expressed as the percentage of positively stained cells, and are presented as the mean +/- S.E.M. of percentage of positively stained cells of three sections from three treated mice. Stained and total cells were counted in four random fields of each section. *, **, *** p<0.05, 0.01, 0.001 vs. vehicle; ‡‡ p<0.01 vs. rapamycin alone. ## p<0.01 vs. PEITC alone. E. Schematic illustration summarizing the mechanisms by which Akt activation elevates ROS levels and sensitizes to either senescence or apoptosis. Activated Akt induces ROS by increasing oxygen consumption combined with the inhibition of FoxO transcription factors. FoxOs elevates the expression of ROS scavengers and in particular sestrin3, which is elevated in Akt-deficient cells. ROS could further activate Akt, which in turn further increases ROS levels. The elevation of ROS then sensitizes cells to either senescence or apoptosis depending on p53 status. Rapamycin, which inhibits mTORC1, further activates Akt, as consequence of the negative regulatory loop inhibition.

Comment in

Similar articles

Cited by

References

    1. Balaban RS, Nemoto S, Finkel T. Mitochondria, oxidants, and aging. Cell. 2005;120:483–495. - PubMed
    1. Bhaskar PT, Hay N. The Two TORCs and Akt. Dev Cell. 2007;12:487–502. - PubMed
    1. Braig M, Lee S, Loddenkemper C, Rudolph C, Peters AH, Schlegelberger B, Stein H, Dorken B, Jenuwein T, Schmitt CA. Oncogene-induced senescence as an initial barrier in lymphoma development. Nature. 2005;436:660–665. - PubMed
    1. Budanov AV, Sablina AA, Feinstein E, Koonin EV, Chumakov PM. Regeneration of peroxiredoxins by p53-regulated sestrins, homologs of bacterial AhpD. Science. 2004;304:596–600. - PubMed
    1. Budanov AV, Shoshani T, Faerman A, Zelin E, Kamer I, Kalinski H, Gorodin S, Fishman A, Chajut A, Einat P, et al. Identification of a novel stress-responsive gene Hi95 involved in regulation of cell viability. Oncogene. 2002;21:6017–6031. - PubMed

Publication types