. 2008 Dec;83(6):787-94.
doi: 10.1016/j.ajhg.2008.11.005.

The genome-wide patterns of variation expose significant substructure in a founder population

Affiliations

The genome-wide patterns of variation expose significant substructure in a founder population

Eveliina Jakkula et al. Am J Hum Genet. 2008 Dec.

Abstract

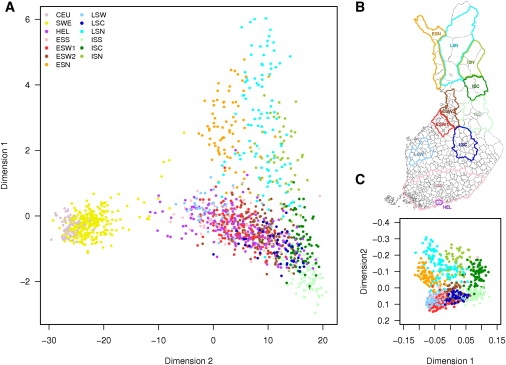
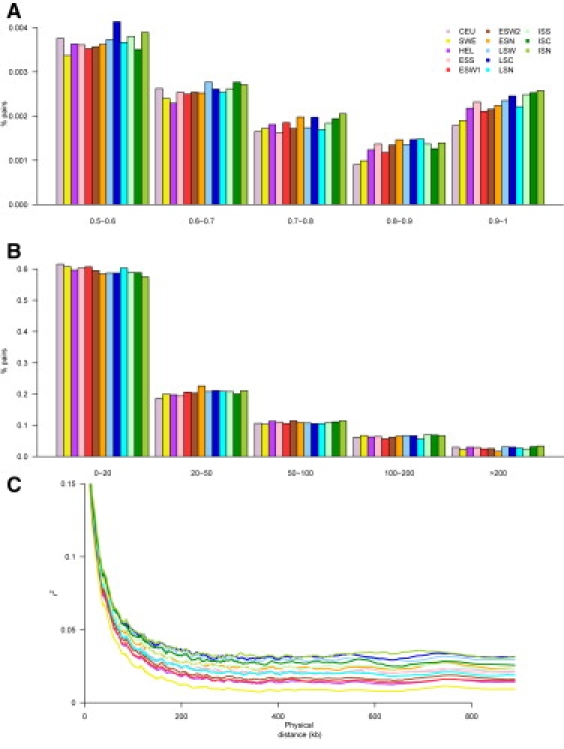
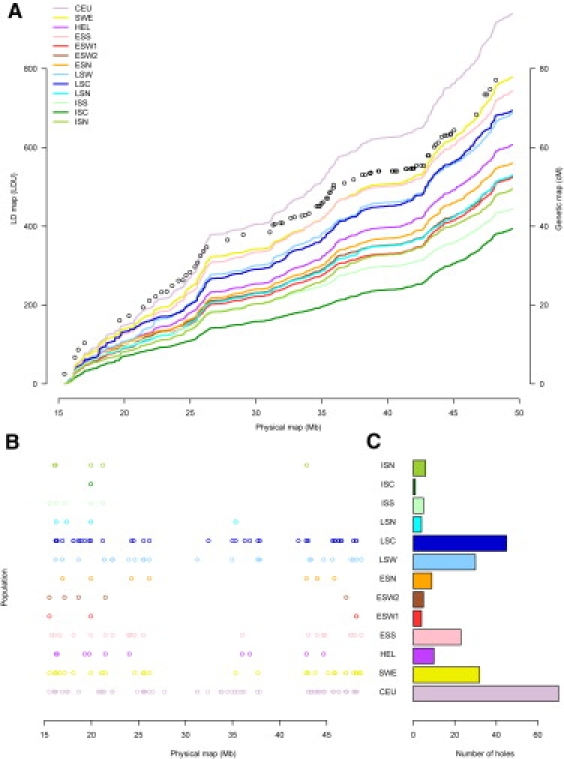
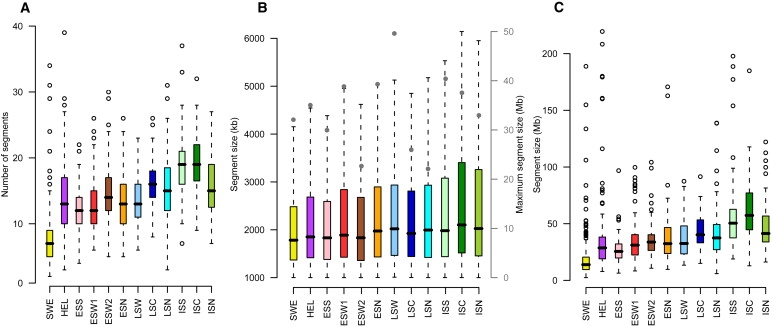
Although high-density SNP genotyping platforms generate a momentum for detailed genome-wide association (GWA) studies, an offshoot is a new insight into population genetics. Here, we present an example in one of the best-known founder populations by scrutinizing ten distinct Finnish early- and late-settlement subpopulations. By determining genetic distances, homozygosity, and patterns of linkage disequilibrium, we demonstrate that population substructure, and even individual ancestry, is detectable at a very high resolution and supports the concept of multiple historical bottlenecks resulting from consecutive founder effects. Given that genetic studies are currently aiming at identifying smaller and smaller genetic effects, recognizing and controlling for population substructure even at this fine level becomes imperative to avoid confounding and spurious associations. This study provides an example of the power of GWA data sets to demonstrate stratification caused by population history even within a seemingly homogeneous population, like the Finns. Further, the results provide interesting lessons concerning the impact of population history on the genome landscape of humans, as well as approaches to identify rare variants enriched in these subpopulations.


Figures

Figure 1
Figure 1
Population Substructure (A) Results of multidimensional scaling in the subisolates as well as the Helsinki, Swedish, and CEU populations. (B) Geographical locations of the subisolates. (C) Results of multidimensional scaling in the subisolates shown on the map in 1b. The following abbreviations are used: CEU, HapMap CEPH; SWE, Sweden; HEL, Helsinki; ESS, early-settlement south; ESW1, early-settlement west 1; ESW2, early-settlement west 2; ESN, early-settlement north; LSW, late-settlement west; LSC, late-settlement central; LSN, late-settlement north; ISS, isolate south; ISC, isolate central; and ISN, isolate north.
Figure 2
Figure 2
Distribution of Correlation, Represented by r2, between Pairs of SNPs on Chromosome 22 (A) Proportion of SNP pairs within different r2 bins the subpopulations. (B) Proportion of SNP pairs with r2 > 0.7 within different SNP distance bins in the subpopulations. (C) Correlation between physical distance and r2. The average r2 was estimated in successive windows of 5000 SNP pairs (4000 SNP pair overlap). Population abbreviations are the same as those used in Figure 1.
Figure 3
Figure 3
LD Maps for Chromosome 22 (A) Comparison of physical distance to LDUs using LD maps. Open circles represent the genetic map and corresponds to the x axis on the right side of the figure. (B) Physical distribution of LD holes, defined by gaps of >2.5 LDU in the LD map. (C) Total number of LD holes. Population abbreviations are the same as those used in Figure 1.
Figure 4
Figure 4
Properties of Extended Runs of Homozygosity in the Different Populations (A) Distribution of number of homozygous segments over 1 Mb per individual. (B) Distribution of the length of homozygous segments over 1 Mb. For clarity, outliers are omitted and is shown in Figure S15. Maximum homozygous segment size is indicated with circles, corresponding to the x axis on the right-hand side of the figure. (C) The total length of chromosomal regions (in Mbs) covered by homozygous segments per individual. The median is indicated by the horizontal line, bars extend to the first and third quartile and error bars extend to 1.5× the interquartile range from the first or third quartile. Open circles indicate observations located more than 1.5× the interquartile range from the first or third quartile. Population abbreviations are the same as those used in Figure 1.

References

    1. Jakobsson M., Scholz S.W., Scheet P., Gibbs J.R., VanLiere J.M., Fung H.C., Szpiech Z.A., Degnan J.H., Wang K., Guerreiro R. Genotype, haplotype and copy-number variation in worldwide human populations. Nature. 2008;451:998–1003. - PubMed
    1. Li J.Z., Absher D.M., Tang H., Southwick A.M., Casto A.M., Ramachandran S., Cann H.M., Barsh G.S., Feldman M., Cavalli-Sforza L.L. Worldwide human relationships inferred from genome-wide patterns of variation. Science. 2008;319:1100–1104. - PubMed
    1. Tian C., Plenge R.M., Ransom M., Lee A., Villoslada P., Selmi C., Klareskog L., Pulver A.E., Qi L., Gregersen P.K. Analysis and application of European genetic substructure using 300 K SNP information. PLoS Genet. 2008;4:e4. - PMC - PubMed
    1. Price A.L., Butler J., Patterson N., Capelli C., Pascali V.L., Scarnicci F., Ruiz-Linares A., Groop L., Saetta A.A., Korkolopoulou P. Discerning the ancestry of European Americans in genetic association studies. PLoS Genet. 2008;4:e236. - PMC - PubMed
    1. Sajantila A., Salem A.H., Savolainen P., Bauer K., Gierig C., Paabo S. Paternal and maternal DNA lineages reveal a bottleneck in the founding of the Finnish population. Proc. Natl. Acad. Sci. USA. 1996;93:12035–12039. - PMC - PubMed

Publication types

LinkOut - more resources