. 2008 Oct;124(4):2106-22.
doi: 10.1121/1.2967864.

Effects of maturation on tympanometric wideband acoustic transfer functions in human infants

Affiliations

Effects of maturation on tympanometric wideband acoustic transfer functions in human infants

Chris A Sanford et al. J Acoust Soc Am. 2008 Oct.

Abstract

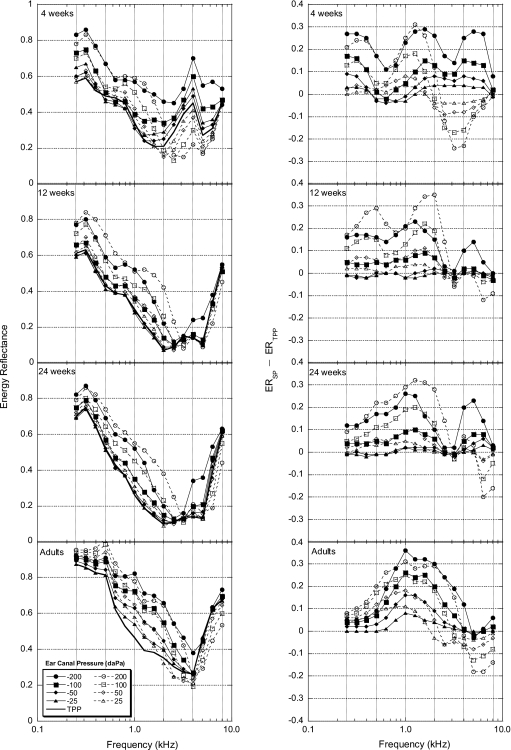
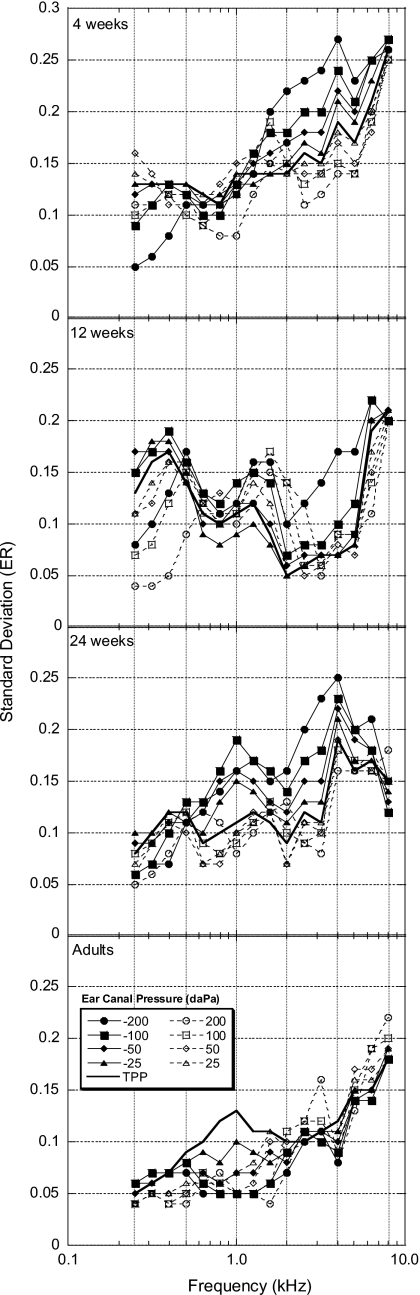
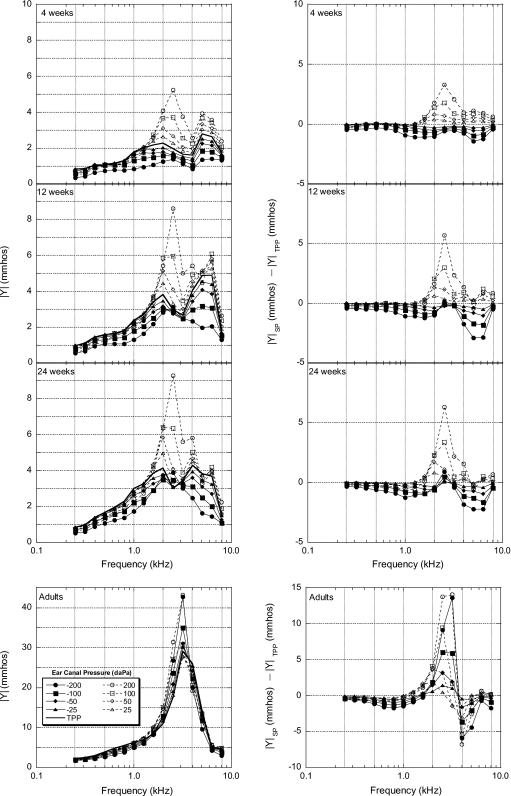
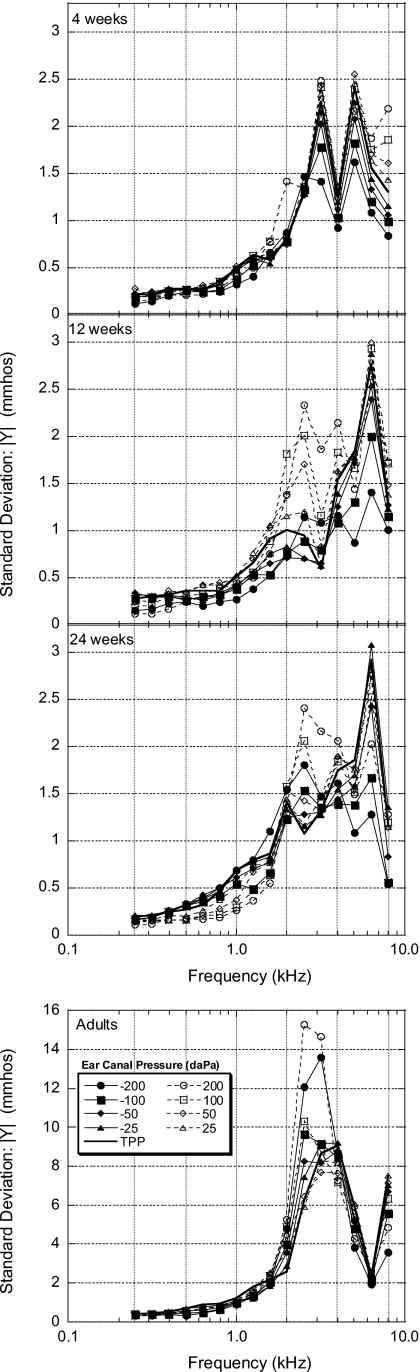
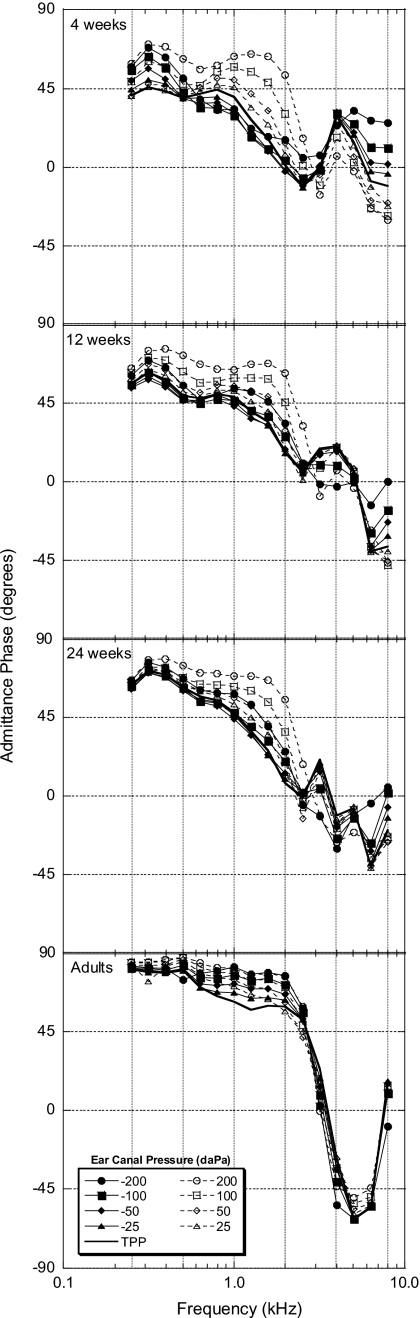
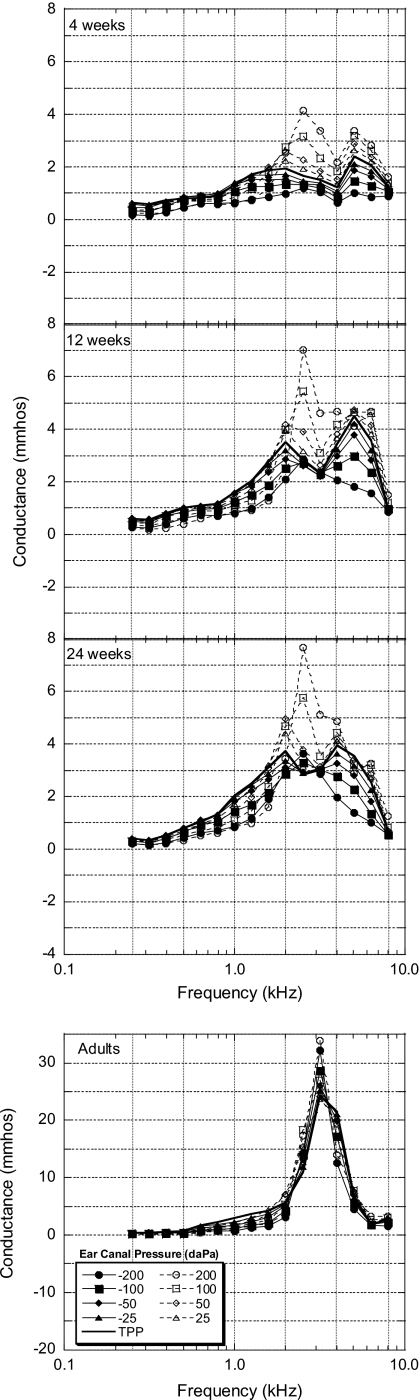
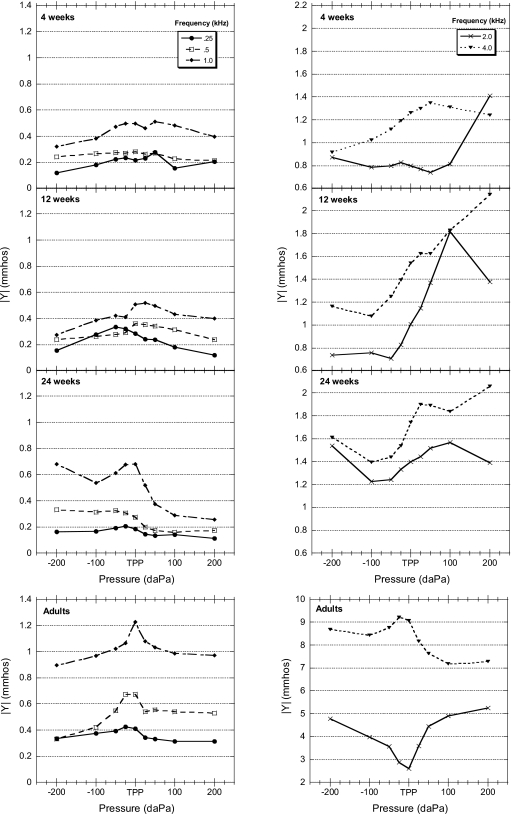
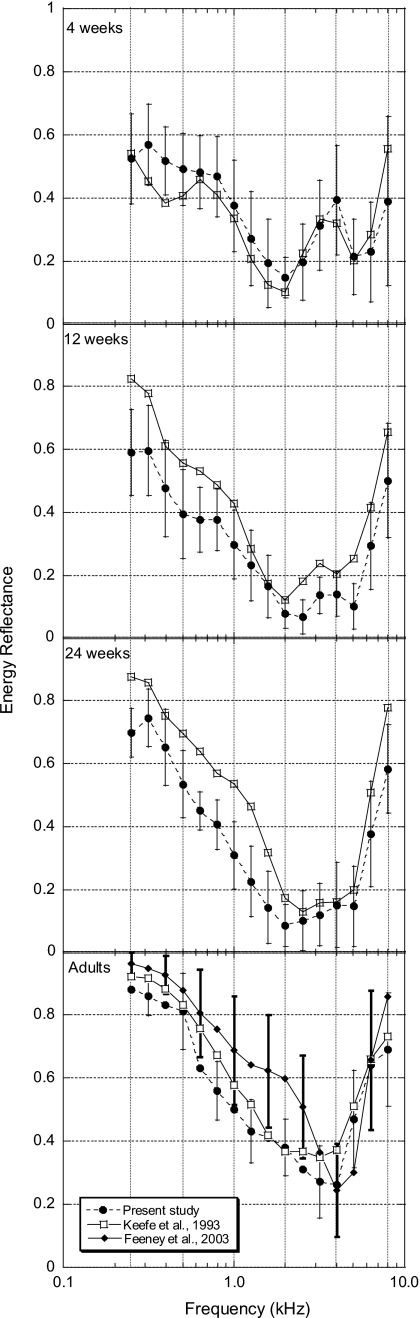
Wideband acoustic transfer function (ATF) measurements of energy reflectance (ER) and admittance magnitude (|Y|) were obtained at varying static ear-canal pressures in 4-, 12-, and 27-week-old infants and young adults. Developmental changes in wideband ATF measurements varied as a function of frequency. For frequencies from 0.25 to 0.75 kHz there was as much as a 30% change in mean ER and mid |Y| with changes in static ear-canal pressure between 4 and 24 weeks of age. From 0.75 to 2 kHz, the effects of pressure produced a small number of significant differences in ER and mid |Y| with age, suggestive of a developmentally stable frequency range. Between 2 and 6 kHz, there were differential effects of pressure for the youngest infants; negative pressures caused increased ER and mid |Y| and positive pressures caused decreased ER and mid |Y|; the magnitude of this effect decreased with age. Findings from this study demonstrate developmental differences in wideband tympanometric ATF measurements in 4-, 12- and 24-week-old infants and provide additional insight on the effects of static ear-canal pressure in the young infant's ear. The maturational effects shown in the experimental data are discussed in light of known age-related anatomical changes in the developing outer and middle ear.


Figures

Figure 1
Figure 1
Group mean one-third-octave energy reflectance (ER) and ER differences (left and right panels, respectively) plotted as a function of frequency for all age groups (N=20 for each group). ER pressure differences are defined as ER at an individual static pressure (ERSP) minus ER at TPP (ERTPP).
Figure 2
Figure 2
Energy reflectance (ER) standard deviations (SDs) as a function of frequency for all age groups. The parameter is ear-canal pressure.
Figure 3
Figure 3
Group mean one-third-octave admittance magnitude (∣Y∣) and ∣Y∣ pressure differences in mmhos (left and right panels, respectively) plotted as a function of frequency for all age groups (N=20 for each group). ∣Y∣ pressure differences are defined as ∣Y∣ at an individual static pressure (Y∣SP) minus ∣Y∣ at the TPPs (Y∣TPP). Note the difference in scales on the y axes for infants and adults.
Figure 4
Figure 4
Admittance magnitude ∣Y∣ standard deviations (SDs) as a function of frequency for all age groups. The parameter is ear-canal pressure. Note the difference in scales on the y axes for infants and adults.
Figure 5
Figure 5
Group mean one-third-octave admittance magnitude (∣Y∣) phase in degrees as a function of frequency for all age groups (N=20 for each group).
Figure 6
Figure 6
Group mean one-third-octave conductance values (mmhos) plotted as a function of frequency for all age groups (N=20 for each group). Note the difference in scales on the y axes for infants and adults.
Figure 7
Figure 7
Group mean one-octave admittance magnitude (∣Y∣), in mmhos, plotted as a function of pressure (daPa) for all age groups (N=20 for each group). Note the difference in scales on the y axes for infants and adults.
Figure 8
Figure 8
Group mean one-third-octave ambient energy reflectance ER as a function of frequency for all ages for the present study (N=20 for each group) and for infants and a group of adults from Keefe et al. (1993). The numbers of subjects for each age group in Keefe et al. (1993) are as follows: 1 month=15, 3 months=18, 6 months=11, and adults=10. The bottom panel also includes young adult ER data (N=40, 75 ears) from Feeney et al. (2003). Error bars indicate ±1 SD from the mean. Note that to avoid overlapping error bars in the lower panel, adult SD data are plotted for alternating frequencies for the present study and Feeney et al. (2003).

Similar articles

Cited by

References

    1. Alaerts, J., Luts, H., and Wouters, J. (2007). “Evaluation of middle ear function in young children: Clinical guidelines for the use of 226- and 1,000-Hz tympanometry,” Otol. Neurotol. ONTEAE 28, 727–732. - PubMed
    1. Allen, J. A., Jeng, P. S., and Levitt, H. (2005). “Evaluation of human middle ear function via an acoustic power assessment,” J. Rehabil. Res. Dev. JRRDEC10.1682/JRRD.2005.04.0064 42, 63–78. - DOI - PubMed
    1. Baldwin, M. (2006). “Choice of probe tone and classification of trace patterns in tympanometry undertaken in early infancy,” Int. J. Audiol. ZZZZZZ 45, 417–427. - PubMed
    1. Calandruccio, L., Fitzgerald, T. S., and Prieve, B. A. (2006). “Normative multifrequency tympanometry in infants and toddlers,” J. Am. Acad. Audiol ZZZZZZ 17, 470–480. - PubMed
    1. Eby, T. L., and Nadol, J. B., Jr. (1986). “Postnatal growth of the human temporal bone. Implications for cochlear implants in children,” Ann. Otol. Rhinol. Laryngol. AORHA2 95, 356–364. - PubMed

Publication types